| Getting Started with NetAdvantage Ignite UI jQuery Controls |
| Written by Ian Elliot | ||||
| Wednesday, 03 July 2013 | ||||
Page 3 of 3
A clientside data gridAs a final example and to give you some idea of what sorts of things are waiting to be discovered in the Ignite UI library let's create something a bit more advanced - a clientside data grid. Add a new HTML file to the project can call it DataGrid. Next add the script tags as usual and a pair of table tags that we are going to use as the basis for the grid control:
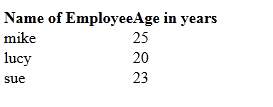
Next we need some data to display in the table and, for the sake of an example, let's just create it using another script:
In general you could have as many fields and rows as you need. In a real example the data would probably be derived as a JSON format file but the principle is exactly the same. Finally we augment the table in the usual way
the option parameters are simple enough:
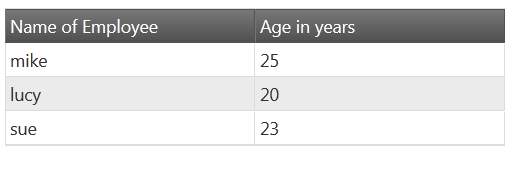
Notice that we define the data and how it is to be treated and then bind the grid to the JSON dataSource. If you now launch the page you will see the data table as promised, but not very well formatted:
Your next step is to improve the format using a suitable style sheet. If you add:
To the start of the page you will see a reasonable layout. Notice that you can use the ThemeRoller to create style sheets interactively and then load them into your page to customize the way things look. All you have to do is select the styles you want to apply and a style sheet is generated.
The complete web page is:
There is so much more to explore. For example, notice how the data grid is fully interactive and allows the user to edit the data and how it can present multiple pages. Using jQuery's Ajax method it is fairly easy to send and receive JSON-formatted data. Now you know how the basics work you can explore the other controls, The basic controls include:
All the controls are touch enabled and a layout manager can be used to provide responsive layouts that should work well on any size of device. In addition there are also some frameworks that enable you to organize larger parts of you application. The Word, Excel and Documents engines only wok in ASP.NET but give you the ability to give the user complete document processing facilities. The templating engine lets you build grids and tree menus. There is a data source which can handle data from oData, WCF, RESTful Domain Data Sources, JSON, XML, local arrays and static HTML tables. Of course, in addition to all of this, there is a complete set of controls that work with jQuery Mobile. jQuery Mobile has some basic controls but Ignite UI extends these to the sort of sophisticated controls that make creating apps easier - ListView, Pivot Grid, NavBar and so on. Infragistics is well known for "polishing" the UI provided by .NET and ASP.NET now it has provided the polish to the HTML/JavaScript UI that can be used no matter how you serve the pages.
Download a trial from the Product Downloads page of the Infragistics website.
Related ArticlesGetting Started With jQuery UI jQuery UI Custom Control - Widget Factory Getting Started With jQuery - The DOM Getting Started With jQuery - CSS Selectors Getting Started With JQuery - Manipulating The DOM
{loadposition signup)
Comments
or email your comment to: comments@i-programmer.info |
||||
| Last Updated ( Tuesday, 08 September 2020 ) |