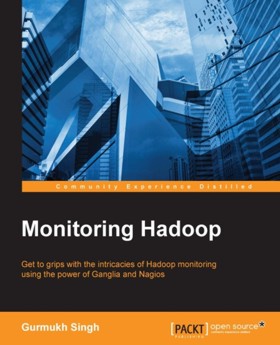
|
Author: Gurmukh Singh
Publisher: Packt Publishing
Pages: 112
ISBN: 978-178328-1558
Print: 1783281553
Kindle: B00WX1CWIW
Audience: Hadoop administrators
Rating: 4.0
Reviewer: Ian Stirk
This book aims to provide details on how to implement monitoring on Hadoop, how does it fare?
With more big data systems being implemented, there’s an increasing need to monitor and report any problems on these systems as soon as possible. This short book aims to show how to use popular tools (Nagios and Ganglia) to provide a monitoring system.
The book is targeted firmly at Hadoop administrators. Expected skills required include: Linux, scripting, administration, Hadoop and its popular components (e.g. HBase).
Below is a chapter-by-chapter exploration of the topics covered.
Chapter 1 Introduction to Monitoring
The chapter opens with a look at downtime costs, and the importance for monitoring. Various factors are discussed when considering a monitoring tool, these include: ease of deployment, licence costs, and impact on system resources. Nagios and Ganglia are the tools discussed in this book, since they are the most popular tools, and are included in many vendor Hadoop distributions.
The chapter next looks in detail at Nagios. This is a scalable monitoring tool, able to provide details of the current state of the system, hopefully highlighting concerns before they become critical. The architecture of Nagios is discussed, consisting of a central monitor server and Nagios clients (agents). Various metrics can be checked (e.g. memory usage). Checks can be initiated by the monitor server (active checks), or by the clients (passive). Communication is via NRPE plug-ins.
Prerequisites for Nagios installation are discussed. Then details of where to download Nagios is given, and step-by-step installation and configuration instructions provided. It’s recommended to install the monitor server on its own server. Details of how to set up the Nagios web interface are provided. Various configuration files that impact Nagios are briefly outlined. Details of how to start the Nagios service on the monitor server are given, followed by setting up monitoring for clients.
The chapter continues with a look at Ganglia, a tool for collecting metrics, and providing visually appealing displays of the metrics (e.g. CPU usage). Details of where to download Ganglia, and step-by-step installation and configuration instructions are given.
The chapter ends with a brief look at system logging. The need for logging is highlighted (e.g. security breaches), together with a brief look at log collection, transport, storage, and alerting.
This chapter discusses the importance of monitoring and logging. It provides brief details on how to get the popular monitoring tools Nagios and Ganglia up and running on your Hadoop cluster.
The chapter’s discussions are relatively brief, providing useful descriptions, diagrams and scripts. These traits apply to the whole of the book.
Chapter 2 Hadoop Daemons and Services
This chapter discusses how Hadoop’s services communicate. Hadoop is highly configurable, with components having configuration files detailing service ports, directories, parameters etc.
Hadoop is briefly described as consisting of the Hadoop Distributed File System (HDFS) and the MapReduce processing model. Various daemons are discussed, together with files/parameters that affect their processing. For Hadoop 1, these are NameNode, DataNode, JobTracker, and TaskTracker. Hadoop 2 has Yet Another Resource Negotiator (YARN), which replaces JobTracker and TaskTracker with ResourceManager and NodeManager respectively.
There’s a useful table listing common Hadoop problems (e.g. slow NameNode response time), together with factors that might fix the problems. There’s a useful diagram showing some standard Nagios checks (e.g. check_disk). Scripts are provided to provide host-level checks.
This chapter provides an overview of Hadoop daemons. Additionally, it sets up monitoring for each node, allowing checking of disks, CPU usage etc. Some useful diagrams are provided, and there’s a useful table of common Hadoop problems and solutions.
A better explanation of YARN should have been provided – it is not a replacement for MapReduce, rather it can accommodate various processing frameworks, including MapReduce. The purpose of the Secondary NameNode should have been described in terms of failover functionality.
Chapter 3 Hadoop Logging
This chapter opens with a look at the importance of logging, being used to track application flow, errors, security breaches, and auditing. The Linux logging daemons are briefly discussed, followed by a look at levels of logging.
The chapter continues with a look at logging in Hadoop, where each daemon writes its own log. These logs are helpful in troubleshooting slowness, connectivity issues, and identifying bugs. Problems of logging are briefly highlighted, including excessive logging, truncation, and retention duration. Various Hadoop logs are discussed, and useful lists of factors that affect the logging daemons are given. Lastly, auditing in Hadoop is described.
This chapter provides a useful overview of the importance of logging. It also details how Hadoop performs logging, the daemons and files involved, together with factors that influence log content.

Chapter 4 HDFS Checks
The Hadoop file system HDFS needs to be optimal (e.g. blocks replicated and balanced over nodes). This chapter describes how to set up monitoring for HDFS components.
Various HDFS checks are described including:
- hadoop dfsadmin – reports HDFS state, number of DataNodes, replication state etc
- hadoop fsck – checks for bad blocks plus options for locations, replication etc
The chapter ends with a look at setting up the Nagios monitor server and clients to implement the various HDFS checks.
The chapter provides a good overview of how to setup monitoring of HDFS components e.g. space usage, replication, and ZooKeeper state.
Chapter 5 MapReduce Checks
This chapter details the checks and monitoring for the MapReduce components. The chapter opens with an overview MapReduce, being a common distributed processing model, having various stages.
The chapter outlines various MapReduce checks that can be performed, including: health of JobTracker, ResourceManager, TaskTracker, NodeManager, backlog of tasks in cluster, and localities of tasks. These checks are documented on the Cloudera website.
The chapter ends with a look at setting up the Nagios monitor server and clients to implement various Hadoop service checks. Scripts are provided to check: JobTracker status, number of alive nodes, heap size of JobTracker, and health of TaskTracker.
This chapter provides a good overview of checks and monitoring for the MapReduce components (e.g. JobTracker), and the various utilization parameters. Useful set up scripts are provided. A link to the relevant Cloudera MapReduce checks page should have been provided.
Chapter 6 Hadoop Metrics and Visualization Using Ganglia
This chapter opens with a look at Hadoop metrics, metrics1 relate to Hadoop 1, and metrics2 relate to Hadoop 2. The various Hadoop daemons collect the metrics, as part of the Hadoop metrics system. Each daemon has a group of contexts associated with it (e.g. dfs, yarn).
The design of the Hadoop metrics system is discussed, being composed of: Producer, Consumers, and Pollers. This is followed by a section on the configuration of metrics, and scripts are provided for both metric1 and metric2 systems . Metrics can be collected by plug-ins.
The chapter continues with a look at integrating Hadoop metrics system and Ganglia (which displays the data). Scripts are provided to configure Hadoop metrics for Ganglia, and setting up Ganglia to communicate with Hadoop. Some simple Ganglia graphs are shown.
This chapter provides an overview of Hadoop’s metrics system, and how it integrates with Ganglia.
Chapter 7 Hive, HBase, and Monitoring Best Practices
This chapter opens with a brief look at Hive, being Hadoop’s data warehouse. The health checks suggested relate to the Hive metastore, the Hive server, and the Hive log and scratch free space. Hive provides basic metrics for JVM profiling, this could be used as input to the Ganglia server for reporting purposes.
The chapter continues with a look at HBase monitoring. HBase is Hadoop’s NoSQL database, consisting of a master and various slave servers (region servers). Scripts are provided to integrate HBase with Nagios monitoring.
Next, monitoring best practices are given. The Filter Class is then discussed, this can be used to filter metrics using regular expressions.
The chapter ends with a look at Nagios and Ganglia best practices, these include:
- Ensure the right balance of active and passive Nagios checks
- Define smart check rather than checking every minute
- Don’t capture everything
This chapter provides a helpful overview of checks for Hive and HBase. The section on “monitoring best practices” should have been called “monitoring considerations”, since best practices are not given. The Nagios and Ganglia best practices, are useful, if brief.
Conclusion
This book aims to provide details on how to implement monitoring on Hadoop, and succeeds. The book is generally well-written, if brief in many sections and some of its discussions are curt. It provides useful descriptions, diagrams and scripts to install and set up monitoring on Hadoop using the popular tools Nagios and Ganglia.
The book is written by a Hadoop administrator for other Hadoop administrators, so you need to be familiar with Linux, administration, scripts etc. It is a quick-start guide, rather than a deep reference.
It should be noted that many popular vendors (e.g. Cloudera), have cluster managers that make installation and configuration of tools like Nagios and Ganglia much easier than the manual instructions given here - this should have been mentioned.
If you want to know how to implement monitoring on Hadoop, using the popular monitoring tools Nagios and Ganglia, I can recommend this book.
Machines Like Me
Author: Ian McEwan
Publisher: Vintage, 2019
Pages: 304
ISBN: 978-1529111255
Print: 1529111250
Kindle: B07HR6SGQ9
Audience: General
Rating: 4.5
Reviewer: Mike James
A novel about a synthetic human has become so much more relevant recently and guess what - it features Alan Turing.
|
Computer Architecture (No Starch Press)
Author: Charles Fox
Publisher: No Starch Press
Date: May 2024
Pages: 560
ISBN: 978-1718502864
Print: 1718502869
Kindle: B0BZH1LB1F
Audience: General
Rating: 4
Reviewer: Harry Fairhead
No, not architecture via a computer - the architecture OF computers.
| | More Reviews |
|

