| Visualize.js |
| Written by Kay Ewbank | |||
| Tuesday, 24 June 2014 | |||
|
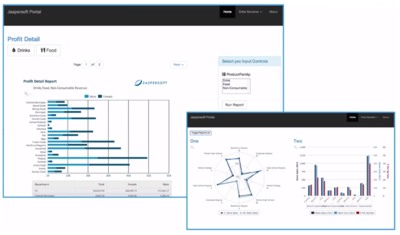
A new JavaScript framework for embedding graphs and reports in apps has been released by Tibco.
The framework has been released alongside Tibco Jaspersoft 5.6. Tibco acquired Jaspersoft in April this year to complement its existing BI (business intelligence) product range. Jaspersoft’s best known product is the JasperReports Server, a Java-based web app that provides report server features including report scheduling, ad hoc reporting, and dashboards. The new framework uses the REST APIs of the JasperReports Server to provide its services in a form that can be controlled using JavaScript. The updates to the Jaspersoft platform mean you can blend relational and Big Data sources such as MongoDB, Hadoop and Cassandra. The software also has improved analytic calculations and graphs with new chart types including spider and bubble, and new interactive reporting features with better zoom and search options.
Visualize.js is bundled with the commercial edition of Jaspersoft, specifically Jaspersoft BI Enterprise or Professional, and is an add-on with Jaspersoft BI Express. It currently does not support JasperReports Server Community Edition or JasperReports Library. You can use it to embed interactive HTML5 visualizations or multi-element reports using standard JavaScript, and can also call backend JasperReports Server services using REST calls for common functions such as user authentication, data connectivity, and repository services. This video shows what Visualize.js is and how to use it:
More InformationRelated Articles
To be informed about new articles on I Programmer, install the I Programmer Toolbar, subscribe to the RSS feed, follow us on, Twitter, Facebook, Google+ or Linkedin, or sign up for our weekly newsletter.

Comments
or email your comment to: comments@i-programmer.info |
|||
| Last Updated ( Tuesday, 24 June 2014 ) |