| SandDance Added To PowerBI |
| Written by Kay Ewbank | |||
| Thursday, 31 March 2016 | |||
|
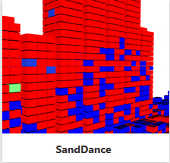
A new data visualization tool has been showcased by Microsoft Research. SandDance is a Microsoft Garage project that is being released in two versions; a standalone Web-based tool and a custom Power BI visual. Garage is Microsoft's outlet for experimental projects, if you've not come across it before see Microsoft Garage - What?, and the idea behind SandDance is that it provides a new type of visualization where every data element is always represented on the screen.
SandDance is coded in SVG and combines multiple charts and animations. The developers say: "every data element is always represented on the screen with animated transitions between views to help people explore, understand and communicate insights from their data." and describe it as: "a framework thathelps define the space of unit visualizations and demonstrated a system that uses unit visualizations at its core. It excels as ways of slicingand dicing the data through a wide number of selection types as wellas comprehensible transformations between different views of multi-dimensional data." SandDance will be included in the Power BI gallery, and you can download it and use it with your own data in Power BI Desktop and Power BI service, on data sets up to 10,000 rows of data. Moving particles represent data, and they can “dance” from screen to screen as you select and filter data and show it the way you want to, through 3D scatterplot, maps, charts, and histograms.
The SandDance Power BI visual is different from most other visuals that already exist for Power BI in that it shows all the data organized into aggregations, allowing users to see both overall patterns as well as individual outliers. The visualization can also be tried out with a number of predefined datasets on the SandDance AzureWebsite, such as passengers on the Titanic, coffee sales, and baby names. While SandDance is being made available 'as is' with no way for developers to extend it, it does give a demonstration of the ways it is possible to extend Power BI with your own custom visualization tool using frameworks such as SVG and D3.js.
More InformationRelated ArticlesA Programmer's Guide to Canvas
To be informed about new articles on I Programmer, sign up for our weekly newsletter,subscribe to the RSS feed and follow us on, Twitter, Facebook, Google+ or Linkedin.

Comments
or email your comment to: comments@i-programmer.info |
|||
| Last Updated ( Wednesday, 30 March 2016 ) |