| Debug the easy way with Canvas |
| Written by Kay Ewbank |
| Tuesday, 14 June 2011 |
|
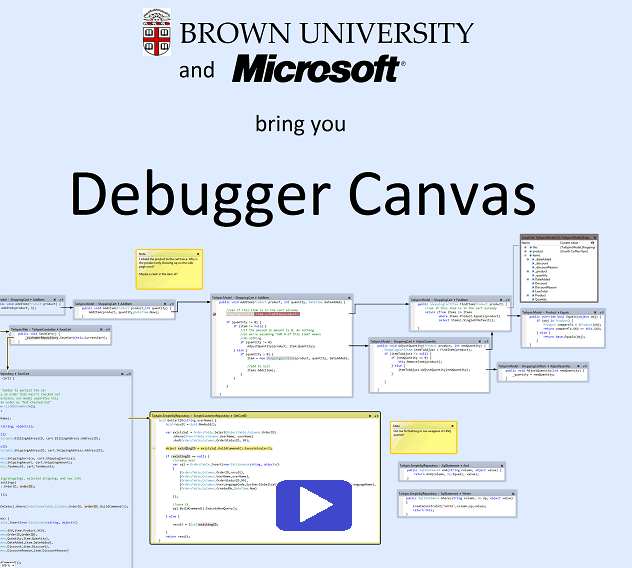
A new debugger for Visual Studio has been released on DevLabs, Microsoft’s ‘incubator’ for developer-based tools. Debugger Canvas adds a new way of debugging called Code Bubbles to Visual Studio Ultimate. Code Bubbles was originally a project developed by Brown University, and Debugger Canvas is the result of a collaboration between Microsoft and Brown University.
When you debug a project using Debugger Canvas you’re shown the code of each of the methods you step into on a background canvas. The methods are shown with call lines between them forming a call path that you can browse and edit. According to a blog post on MSDN, Debugger Canvas takes advantage of Visual Studio 2010’s new code editor to show fragments of files as bubbles on the canvas with a fully functioning editor in each. The Power Tool is only available for Visual Studio Ultimate, and it is limited to projects based on C# and VB in this release with plans to add support for other languages in the future. The blog says that building on VS Ultimate also allowed Microsoft to provide a new user experience for IntelliTrace, enabling some interesting scenarios, such as “show me what code ran when I clicked here”. When you debug using Debugger Canvas, code is shown in bubbles on the background canvas. Each bubble represents a member definition rather than an invocation of a method. What this means is that if you step into a method a second time, Debugger Canvas shows the execution in the same bubble as the first time. Bubbles are only opened on specific user actions such as stepping into a method, hitting a breakpoint, or double clicking on a method. To see it in action watch the promo video below:
You can download Debugger Canvas to try for yourself here: http://msdn.microsoft.com/en-us/devlabs/debuggercanvas

|
| Last Updated ( Tuesday, 14 June 2011 ) |