| Developer Work and Pay |
| Written by Janet Swift |
| Friday, 17 April 2015 |
|
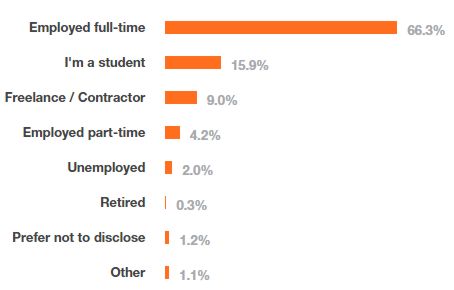
Our third and final look at the Stack Overflow survey covers its findings on what devs do, how much they are paid for it and how satisfied they are with their jobs. As the Stack Overflow 2015 Developer Survey indicates, if you are a software developer you are likely to have a job - or be a student:
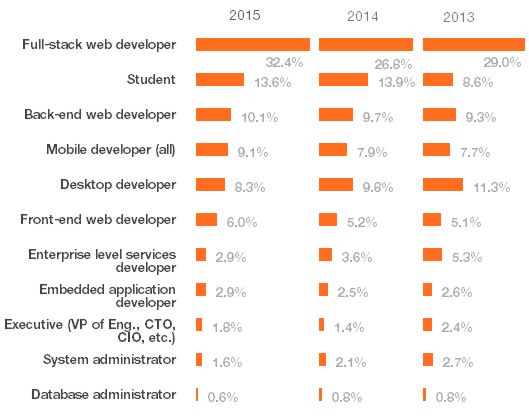
Only 2% of more than 21K respondents to the survey were unemployed. Over 22K developers provided information about their occupation, for the third year in a row, full-stack web developer has been the selected as the occupation that best describes what respondents do, with back-end web developer now coming next, having overtaken desktop developer. Web developer now accounts for almost half of the population:
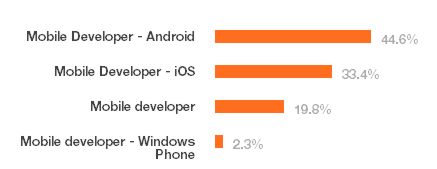
Among 1,900 respondents in the mobile developer category Android devs outnumber iOS devs while Windows Phone has a very small showing:
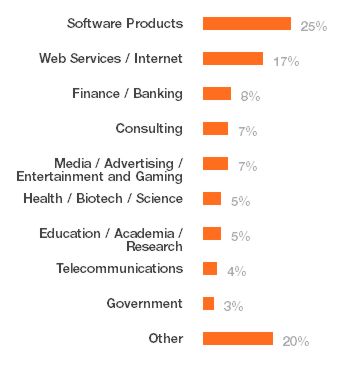
When it comes to the industries they work in a quarter of respondents nominate software products on a global basis - but this varies from 45% in Asia through 29% in Eastern Europe to just 18% in the United States:
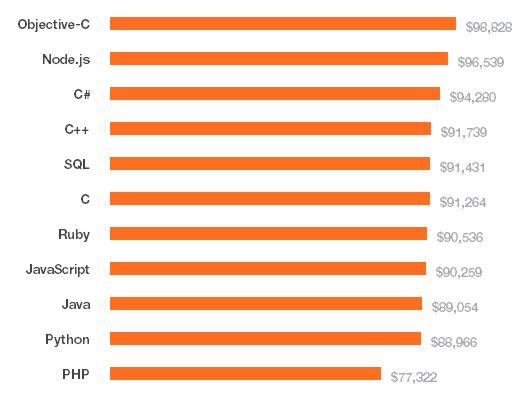
Similarly while 17% overall are in Web Service/Internet only 14% of US developers are in this area compared to 21% in Eastern Europe and 19% in Asia. The "Other" response is boosted to 27% in the United States. As the report comments: Respondents from developed countries are more likely than others to say they work in an industry outside the traditional software powerhouses. The other respect in which US developers are at an extreme are the amount they are paid. This is the league table of compensation by technology for the United States:
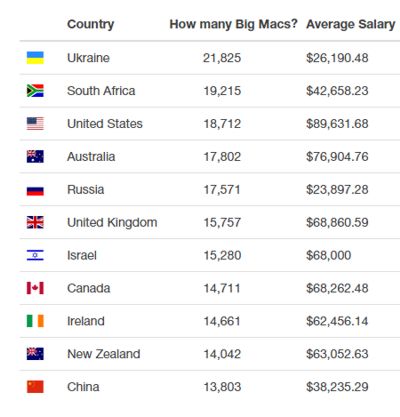
While Objective-C pays best in the US, Ruby tops the list in Western Europe but at only $60,00 and Node.js is the best paid technology in Eastern Europe but at less than half that ($28,543). It isn't particularly meaningful to make this sort of comparison because the cost of living varies so much between different regions of the world. As Stack Overflow explains: When it comes to quality of life, dollars, Euros and Yen don't matter. Big Macs matter. The Economist's Big Mac Index is a measure of purchasing power parity that can be used to compare the true value of compensation between workers in different economies. Using this index Ukraine comes top, followed by South Africa with the United States in third place:
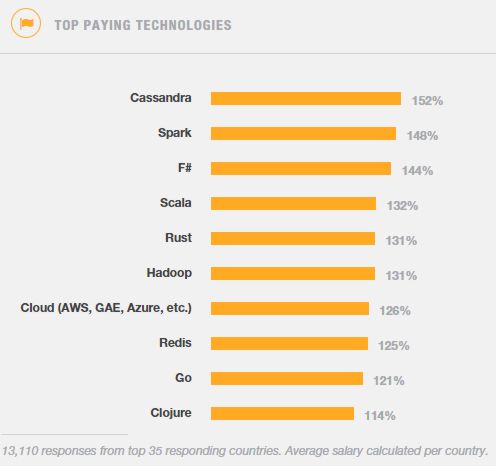
The survey look into factors affecting compensation. One was competence in sought-after technologies. The report states: Niche or emerging technologies pay big bucks. So does big data and cloud computing. This may reflect a shortage of certain skills in the workforce – companies are willing to pay more when hiring for cutting edge skillsets. It's also likely that developers with niche competencies are just better developers all around.
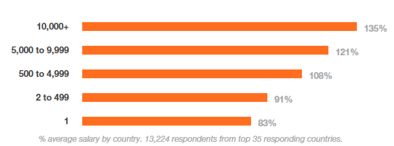
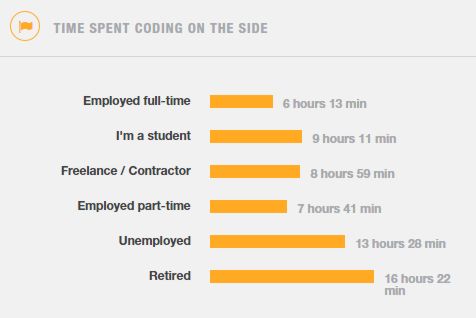
Another was being a remote worker. Almost 30% of those surveyed work remotely at least part of the time, up from 21% last year. Full-time remote workers are paid on average 114% of the average salary on a global basis and 150% in Russia. Another way to look at it is that they earn 40% than those who never work remotely. This of course is the Stack Overflow survey so the report has an analysis that shows that Stack Overflow reputation is correlated to compensation: Among over 13K respondents those with a rep of over 500 earn over the average for the survey. Developers tend to like what they do. To prove this point the survey asked about the amount of time developers spent coding on the side. It revealed that: The average fully employed developer spends more than 6 hours every week working on open source, side- or hobby projects. Retired developers spend nearly 3 times as many hours on hobby projects. Code is life for most devs, and for many coding is a lifetime pursuit.
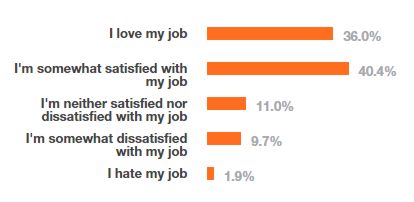
So at the end of the day how satisfied are developers with their lot? This is what the survey finds:
Job satisfaction varies by country with Iran, Netherlands, Norway and Israel having the highest satisfaction scores. It also varies by type of job. Not surprisingly those at the top are most satisfied with VP of Eng, CTO and CIO having the highest satisfaction scores. Next comes "Machine learning developer" and the "Mobile Developer". Product manager is the least satisfying job, followed by "Business intelligence or data warehousing expert" and "Graphics programmer". More analysis would be needed to explain these variations - but Stack Overflow has already provided enough information to reveal a lot about developers. More InformationStack Overflow 2015 Developer Survey Related ArticlesStack Overflow Developer Characteristics Survey Reveals Developer Preferences

Comments
or email your comment to: comments@i-programmer.info |
| Last Updated ( Wednesday, 07 August 2024 ) |