|
Page 1 of 2 Its a right of passage - you have to draw a 3D cube to prove you can! It also needs a deep understanding of WebGL. This extract from Ian Elliot's book on JavaScript Graphics looks at how to use typed arrays to access graphic data.
Now available as a paperback or ebook from Amazon.
JavaScript Bitmap Graphics
With Canvas
Contents
- JavaScript Graphics
- Getting Started With Canvas
- Drawing Paths
Extract: Basic Paths
Extract: SVG Paths
Extract: Bezier Curves
- Stroke and Fill
Extract: Stroke Properties
Extract: Fill and Holes
Extract: Gradient & Pattern Fills
- Transformations
Extract: Transformations
Extract: Custom Coordinates
Extract Graphics State
- Text
Extract: Text, Typography & SVG
Extract: Unicode
- Clipping, Compositing and Effects
Extract: Clipping & Basic Compositing
- Generating Bitmaps
Extract: Introduction To Bitmaps
Extract : Animation
- WebWorkers & OffscreenCanvas
Extract: Web Workers
Extract: OffscreenCanvas
- Bit Manipulation In JavaScript
Extract: Bit Manipulation
- Typed Arrays
Extract: Typed Arrays
- Files, blobs, URLs & Fetch
Extract: Blobs & Files
Extract: Read/Writing Local Files
Extract: Fetch API
- Image Processing
Extract: ImageData
Extract:The Filter API
- 3D WebGL
Extract: WebGL 3D
Extract: A 3D Cube **NEW!
- 2D WebGL
Extract: WebGL Convolutions
<ASIN:B07XJQDS4Z>
<ASIN:1871962579>
<ASIN:1871962560>
Not in this extract:
- 3D WebGL
- The Canvas and the Viewport
- Shader Theory
- Vertex Shader
- Fragment Shader
- Shader practice
- The Matrices - Connecting with the Shaders
- Perspective Transformation
- Vertex Data
- Final Setup and Drawing
A 3D Cube
Although our example is enough to introduce most of the aspects of using WebGL in 3D, we need something slightly more realistic to demonstrate the possibilities. The usual first example is a 3D cube. This is easy enough, but first we need to create a better and more flexible perspective transform. The usual way to think of a perspective transform is as a camera positioned within the 3D space, looking at a particular point and with an adjustable angle, which corresponds to the focal length of the camera lens and a front and back clipping plane which limits what is drawn:
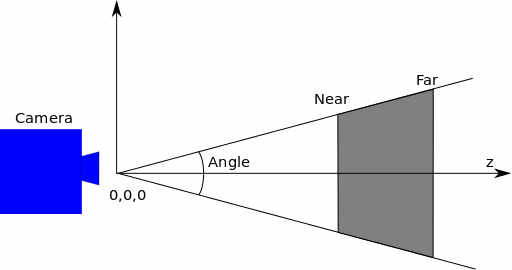
The transformation is generally arranged so that the viewpoint is at the origin and looking along the z axis into the screen. You can easily create a function to generate a perspective transformation from these parameters:
function perspective(angle, aspect, zMin, zMax) {
   var tan = Math.tan(angle*Math.PI/180);
   var A = -(zMax + zMin) / (zMax – zMin);
   var B = (-2 * zMax * zMin) / (zMax - zMin);
   return [
           .5 / tan,                 0, 0, 0,
                  0, .5 * aspect / tan, 0, 0,
                  0,                 0, A, -1,
                  0,                 0, B,  0
          ];
}
You can look up how this is derived in almost any book on 3D graphics. The aspect is included so that you can adjust the ratio of x to y.
A reasonable projection is:
var pMatrix = perspective(20, 1,0.1, 100);
Given that the “camera” is now positioned at the origin you might think that it is required to draw things positioned away from the origin so that they can be seen. This is not a good idea and generally we follow the same principle as used in 2D graphics – draw a unit-sized object centered on the origin and use a transformation to position it.
To draw our unit cube we need a set of vertices:
var vertices = new Float32Array(
 [
  // Front face
  -1.0, -1.0, 1.0,
   1.0, -1.0, 1.0,
   1.0, 1.0, 1.0,
  -1.0, 1.0, 1.0,
  // Back face
  -1.0, -1.0, -1.0,
  -1.0, 1.0, -1.0,
   1.0, 1.0, -1.0,
   1.0, -1.0, -1.0,
  // Top face
  -1.0, 1.0, -1.0,
  -1.0, 1.0, 1.0,
   1.0, 1.0, 1.0,
   1.0, 1.0, -1.0,
  // Bottom face
  -1.0, -1.0, -1.0,
   1.0, -1.0, -1.0,
   1.0, -1.0, 1.0,
  -1.0, -1.0, 1.0,
  // Right face
   1.0, -1.0, -1.0,
   1.0, 1.0, -1.0,
   1.0, 1.0, 1.0,
   1.0, -1.0, 1.0,
  // Left face
  -1.0, -1.0, -1.0,
  -1.0, -1.0, 1.0,
  -1.0, 1.0, 1.0,
  -1.0, 1.0, -1.0,
]);
This is a lot of data, but a cube has six faces and each face has four defining points. You might be puzzled as to why we only need four points if each face is made up of two triangles. The answer is that we specify that the vertex data is in the form of a triangle strip. A triangle strip starts off with three vertices that define the first triangle. After this each additional vertex defines a triangle with the previous two vertices:
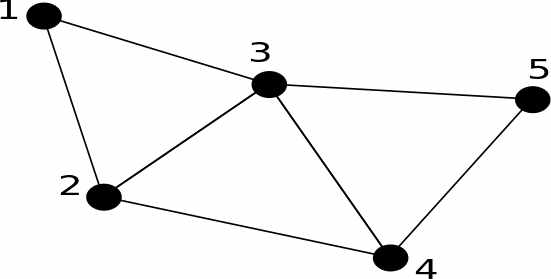
In the diagram you can see that vertices 1, 2 and 3 define the first triangle, 2, 3 and 4 the second, and 3, 4 and 5 the third. This saves having to repeat vertices. Each rectangle is defined by four vertices. For example, the front face is:
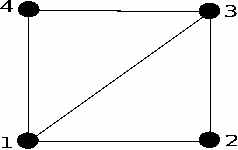
Notice that the face is defined in an anti-clockwise order. This is important because it defines the front facing side of the triangles.
|