| Understanding the Fourier Transform |
| Written by Stuart Riffle | |||
| Wednesday, 14 March 2012 | |||
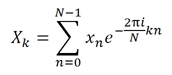
Page 1 of 2 The Fourier transform crops up in a wide range of everyday programming areas - compression, filtering, reconstruction to mention just three general areas. You can get away with using it without understanding the math. On the other hand, knowing about it might come in handy and this way of thinking about it is novel and might work for you. Yes, I realize that after reading the title of this article, 99% of potential readers just keep scrolling. So to the few of you who clicked on it, welcome! Don’t worry, this won’t take long. A very long time ago, I was curious how to detect the strength of the bass and treble in music, in order to synchronize some graphical effects. I had no idea how to do such a thing, so I tried to figure it out, but I didn’t get very far. Eventually I learned that I needed something called a Fourier transform, so I took a trip to the library and looked it up (which is what we had to do back in those days). What I found was the Discrete Fourier Transform (DFT), which looks like this:
This formula, as anyone can see, makes no sense at all. I decided that Fourier must have been speaking to aliens, because if you gave me all the time and paper in the world, I would not have been able to come up with that. Eventually, I was able to visualize how it works, which was a bit of a lightbulb for me. That’s what I want to write about today: an intuitive way to picture the Fourier transform. This may be obvious to you, but it wasn’t to me, so if you work with audio or rendering, I hope there’s something here you find useful. Disclaimer: my math skills are pitch-patch at best, and this is just intended to be an informal article, so please don’t expect a rigorous treatment. However, I will do my best not to flat-out lie about anything, and I’m sure people will set me straight if I get something wrong. A quick bit of background – what does the Fourier transform do? It translates between two different ways to represent a signal:
Click to enlarge
The picture on the left shows 3 cycles of a sine wave, and the picture on the right shows the Fourier transform of those samples. The output bars show energy at 3 cycles (and, confusingly enough, negative 3 cycles… more on that below). The inputs and outputs are actually complex numbers, so to feed a real signal (like some music) into the Fourier transform, we just set all the imaginary components to zero. And to check the strength of the frequency information, we just look at the magnitude of the outputs, and ignore the phase. But let’s never mind all that for now. What are we trying to accomplish? We’ve got a sampled signal, and we want to extract frequency information from it. The Fourier transform works on a periodic, or looping signal. This seems like a problem, since we don’t actually have any signals like that. In practice, you just take a small slice of a longer signal, fade both ends to zero so that they can be joined (which is a whole topic unto itself), and pretend it’s a loop. Let’s make things simple and say that our loop repeats once per second.
Picture it as a bead, sliding up and down along a thin rod, tracing out the signal. So as this bead is bobbing up and down, look what happens if we spin the rod at a rate of, say, 10 revolutions per second:
We get a scribble, as you’d expect. And it is roughly centered on the origin. Now, let’s assume we know there’s some energy in the signal at 3 Hz, and we want to measure it. What that means is that on top of whatever else is causing the signal to wobble around, we’ve added a wave that oscillates 3 times per second. It has a high point every 1/3 of a second, and corresponding low points in between, also spaced 1/3 of a second apart. You can probably see now how we might be able to detect it… let’s try spinning our signal at a matching rate of 3 revolutions per second.
Since the signal completes a rotation every 1/3 of a second, all the high points in our 3 Hz wave line up at the same part of the rotation, and this pulls the whole scribble off-center. |
|||
| Last Updated ( Wednesday, 14 March 2012 ) |