| Monitor Mobile |
| Written by Ian Elliot | |||
| Thursday, 05 June 2014 | |||
Page 1 of 2 Monitoring mobile apps should be easy, all you need to do is arrange to send the data back to a server - but what server? There is enough to do without having to implement a complete monitoring system as well.
The easiest option is to use someone else's server and that's what I did with my latest complicated app that involved interaction with a web site. As I needed something that could monitor a web server and an Android app I continued my exploration of the New Relic analytics and monitoring as a service system. To start off though I tried the solution out on a simple small Android app to see how it all worked. Adding Monitor CodeThe biggest worry is that adding someone else's monitor code to your code is going to make a mess of your app. However, the New Relic instrumentation is particularly unobtrusive and easy to use. If the key test is always how easy it is to remove, the good news in this case is that it is trivial.
The exact nature of getting everything set up depends on whether you are using Android or iOS, and with Android what development system you are using. The fine detail may differ but the general procedure is more or less the same. I used Android Studio and added the requisite code via Gradle. If you are new to Android Studio, and Gradle in particular, this can seem a bit scary, but in practice it is a huge simplification. If you are expecting to have to manually download a library and install it then forget it because Gradle does it all for you. All you have to do is provide the name of your app and add some lines to the build.Gradle file that you will find in the app directory. Add the lines listed in the setup instruction to the end of the file. Next you need to provide INTERNET and ACCESS_NETWORK_STATE permission to the AndroidManifest.xml file in the src directory. You can add the two lines needed just after the <manifest> tag. Of course, if the app already has these permissions you don't need to add them at all. Finally we get to the modification you need to make to the source code. This is the surprising part. All you need to do is to add:
and:
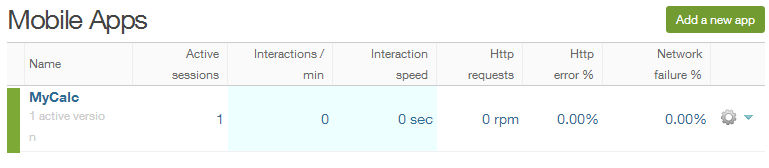
These lines starts the monitoring going and need to be placed in your app's onCreate method. That's it! If you need to undo the changes you have a single line of code and an import statement to remove There is only one possible mistake you could make. The "app token" that you have to enter isn't the License key that was generated when you signed up to a New Relic account. Each app that you want to monitor has a different application token which is generated when you enter the name of the app. If you use the instructions that are provided to "Add a new app" then the generated app token is shown in the instruction and all you have to do is copy and paste. If you clean the project and rebuild it then as long as you have the correct app token you will see data being collected in a few minutes. You don't have to use a real Android device; the monitoring code works with the emulator as long as there is Internet access. The DashboardAfter adding the the code to your app you can start seeing the data flow into the monitoring dashboard. Even if you have used the same New Relic technology on a web site it comes as something of a shock to discover that you get to see the data from all of the people using your app at that moment. This may seem obvious but if you are testing things out you will only see your single instrumented test instance - remember that when you go live all of your users contribute data. The Dashboard shows the status of all of the apps you have instrumented and there is a traffic light indicator that shows the health of your app. This is mainly a function of how well it is communicating with the Internet and your backend server.
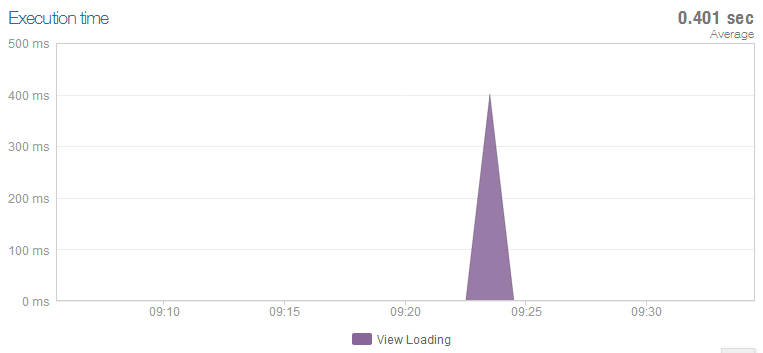
It helps to remember when you are trying things out using a simulator that this dribble of information grows when you do the same thing for real! You can select any of your apps from the dashboard to display more detail. The overview shows you how much time is being taken by different operations within your app. This is an average for all of the active sessions so what it is actually showing you is a snapshot of your apps actual activity at any given time. The instrumentation tracks anything that the user does to interact with your app - from starting it up, posting a photo, updating a profile etc. You get individual data for each interaction. If you drill down you can see thread type, class and method name, percent of execution time, average number of calls per interaction and overall average execution time.
You can select various parameters to narrow down the data displayed - data, app version and specific operations within your app. You can also see which are the slowest operations and notice that this is again an average across all of the active sessions so you are seeing the effects of running the app on different hardware. It is a bit like having a profiler running on a large set of machines at the same time. It is also easy to get the status of the device that the app is running on. You can see how much memory, cpu and database your app is using on the device. As well as getting performance data you can also gather some data that might be useful in marketing and guiding the future improvements to your app. You can easily find out the distribution of device types and which version of the OS are faster than others. You can even get monthly uniques to show how successful your app actually is.
|
|||
| Last Updated ( Thursday, 05 June 2014 ) |