| Analytics As A Service |
| Written by Ian Elliot |
| Thursday, 10 July 2014 |
|
If you think that Google Analytics is the last word in finding out how your web site is being used then you need to think again. There may well be a better option. If you have been following my progress in instrumenting a web app and its backend server you'll know I've been using New Relic's Application Monitoring. What was most surprising was the ease of implementing the instrumentation and how much information was available for so little work.
At this point I have my app and backend service working, but I'd like to gather some information on how people are using it. In previous projects I had turned to Google Analytics for this sort of information but working with the Tracking API isn't easy and this limited the range of data I went after. Given that I had gone with New Relic's Application Monitoring and had everything needed to try its new Insights Realtime Analytics, it seemed an obvious solution.
The key initial advantage is that you don't have to do anything extra to make it work. As long as you have installed the latest New Relic Agent, there is nothing more to do to your app or server. The Agent gathers page view data and transactions. Each of these has a set of attributes that provides the analytics. For example each page view has the name of the invoked web transaction, controller, show or what ever, the country and the browser and server response times. Transactions include the database response time, the externals response time and the total response time.
Custom attributesJust the standard attributes provide useful information, but if you want to find out in more detail how your app is being used there really is no alternative but to add custom attributes and custom events. This is unavoidable in any analytics system you can think of because only you know the structure of your app and what aspects of its use you are interested it. Adding custom attributes is very easy. First you have to compute the value that is of interest using JavaScript. For example, on a checkout page you might compute the shopping cart's total value in cartTotal. To return this as a custom attribute all you have to do is add a single line:
The first paramter gives the name of the attribute that will apear in the analysis of the data. It is this simple - one line per new attribute. Custom attributes usually provide all of the extra data you need but sometimes you need to add a custom event to capture some behaviour other than a page load or a server transaction. Suppose you want to record the number of times a user removes an item from the shopping cart then you need a custom event because this doesn't necessarily cause a page load or a server transaction. Getting a custom event to work is a little more complicated than an attribute because you have to warn the New Relic server that the event is going to happen. To do this you have to first register for an API insert key. You can do this via the dashboard and it is a completely automatic process. The key is used to authenticate the data coming from your app and to identify the event. Once you have the key all you have to do to signal your custom event to the server is generate a JSON data object and send it. The JSON object has to follow a standard format:
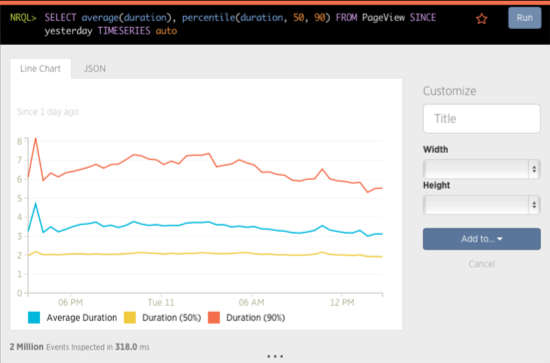
You can have multiple attribute values and the values can be strings or numeric - no objects or Booleans allowed. You can assemble an array of events to send to the server in once operation. To send the event data you simply post it with correct headers to the server. Exactly how you do this depends on the language you are using and the environment. A cURL query is automatically generated for you to use with languages such as PHP that have cURL. Looking at dataOnce you have the agent setup with custom attributes and events as required you can start looking at the data. As with Application monitoring the data streams in and can be analysed in real time. The big difference between monitoring and Insights is the use of NRQL a modified form of SQL query. If you know SQL you will find NRQL very easy to use. You type in your NRQL query into the query tool and it helps with autocompletions. When you run your NRQL query the output is returned as JSON data but this can be displayed using any of the appropriate widgets which are then displayed in a dashboard. For example, if you create an NRQL query which includes the TIMESERIES clause then the returned data will be displayed in the Line Chart widget:
So for example an NRQL query to generate a Line Chart might be something like:
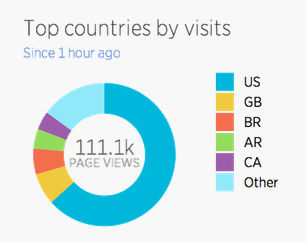
Once you understand the way in which NRQL incorporates time in a natural way it is easy to generate charts of all the important data. You can also use it to generate tables, summary statistics, pie charts and so on.
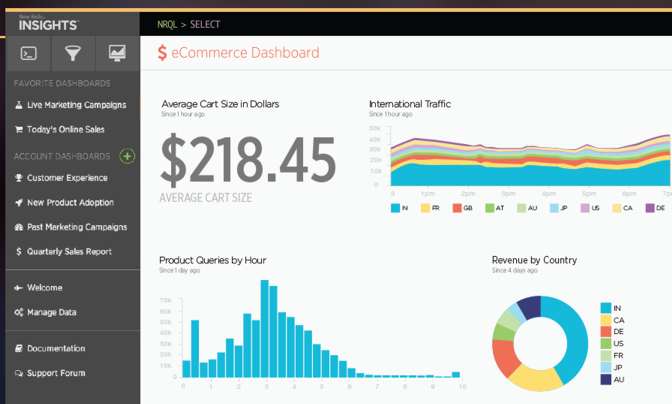
Of course all of these charts and data presentations that you create can be added to dashboards so that non-programming members of the team can look at what is going on. It is also easy to add additional custom presentations and dashboards when they ask for the information. It is also possible to show non-programmers how to use NRQL without getting involved in anything very technical - just don't tell them it is a form of SQL! You need to keep in mind that the data is real time and charts and dashboards show data for the time period you specify in the NRQL, for example the current hour. This means you can get both historical summaries of how your system is doing and snapshots of how it is performing now.
NRQL queries can also be run via a query API. You simply submit it with a query key and you get back the raw JSON data. This makes it possible to integrete Insights analytics with other products. Currenlty Zapler, Runscope, Duckboard and Drupal are supported, but it looks fairly simply to integrate other products using the API. If you are using New Relic's instrumentation for app monitoring then using it to acquire analytics is a no-brainer. It is hardly any additional work and NRQL makes it possible to get at the data you collect.
To be informed about new articles on I Programmer, install the I Programmer Toolbar, subscribe to the RSS feed, follow us on, Twitter, Facebook, Google+ or Linkedin, or sign up for our weekly newsletter.
More InformationRelated Articles
Comments
or email your comment to: comments@i-programmer.info
|
| Last Updated ( Friday, 11 July 2014 ) |