| Biorhythms - a calculator and chart |
| Written by Janet Swift | |||
| Friday, 20 November 2009 | |||
Page 1 of 2 Spreadsheet charts are usually thought of as being employed in a business context or else in science and engineering. This example is personal – we are going to chart biorhythms. BiorhythmsIf you have never come across the biorhythms hypothesis before it is an elegantly simple one. All human beings are subject to three regular and constantly repeated cycles - a physical cycle that is 23 days long, an emotional cycle of 28 days and an intellectual one of 33 days. The idea that cyclical patterns affect our physical and emotional states originated around 1880 when a German physician, Dr Wilhelm Fleiss and a Viennese psychologist, Dr Hermann Swoboda, each working independently in separate locations, reported their observations of groups of human subjects they were studying. The third cycle, relating to intellectual performance was proposed some 50 years later by Dr Alfred Teltscher who was studying the examination performance of about 5,000 students. Although the theory has never been accorded complete academic respectability is has gained acceptance in many countries and in many industries. Even so its fun and provides an excellent example of spreadsheet charts and graphs. Intuitively this idea appears to have a lot going for it. People often express the idea that life is like an ever-turning wheel and sayings like "on the crest of a wave" or "in a rut" are universal ways of indicating our state of well being. It explains the seemingly irrational ups and downs that we all experience - why sometimes we seem to be more clumsy, more easily upset or more stupid than at other times and at others we are surprisingly strong and agile, feeling "on top of the world" or have flashes of brilliance. Biorhythms are entirely time-related. The hypothesis assumes that at the point in time a person is born all three cycles start out at 0 and they then follow their three set curves going to high then back through 0 to low for ever more. So the only two pieces of information you need to work out where a person is in his or her biorhythm cycles is their date (or to be precise, time) of birth and the date (or time) they want to know about - and in most cases that will be the current point in time. A Biorhythms SpreadsheetArmed with this theory we are ready to create a spreadsheet that will calculate, and chart, an individual's biorhythms. The first step is to type in the titles, labels and numbers as shown below: 
Next we need to consider the two items of data needed to fill in cell B5 "Elapsed time since birth". If I asked you how long or how many days and hours have elapsed since you were born without recourse to a spreadsheet you would find it a difficult question to answer. This is because date and time arithmetic is inherently difficult for us humans - but not for a computer. A spreadsheet coverts whatever dates you type in to date serial numbers and stores them as any other number and this simplifies calculations involving dates. So rather than enter a value in B5 we need to enter the individual's date of birth in B3. Date entry is something that has become a lot simpler as spreadsheets have evolved. Originally you would have needed to use a date function to convert a date into its underlying date serial number plus date formatting to make it display as a date. These days spreadsheets recognize dates in many formats so all you have to do is type something like 11/20/09 or 20-Nov-09 in B3. Do check to make sure the spreadsheet you are using follows the conventions you expect. For example 03/04/10 is 4th March to a spreadsheet working with US settings and 3rd April to one with UK settings. If you use a format with the abbreviations Jan, Feb etc you can avoid this confusion. As already mentioned if you want pinpoint precision you can use the time of birth. Fortunately this is also an easy thing to do with a spreadsheet using 24-hour time notation. For example for a birth at 10 o'clock in the morning on 3rd March 1984 enter: 3-Mar-84 10:00 in B3 or for one at a quarter past seven in the evening of 15th August 1967: 15-Aug-67 19:15 Even though we have typed in the time information what is displayed is just the date. This is due to our use of month abbreviations and could be remedied by choosing an alternative date and time format - but if you look at the input line you will see that Excel has taken notice of the time entered. If you want to enter the current time and have it updated every time you open the spreadsheet you have a choice of two functions, TODAY which will calculate the values for midnight at the start of the current day or NOW which is accurate to the nearest second. For this example let's use the current time - and every time you open or recalculate the spreadsheet it will update using the computer's internal clock. So type: =NOW() into B4 As long as you have already entered the date of birth in your preferred format it should display using the same convention.
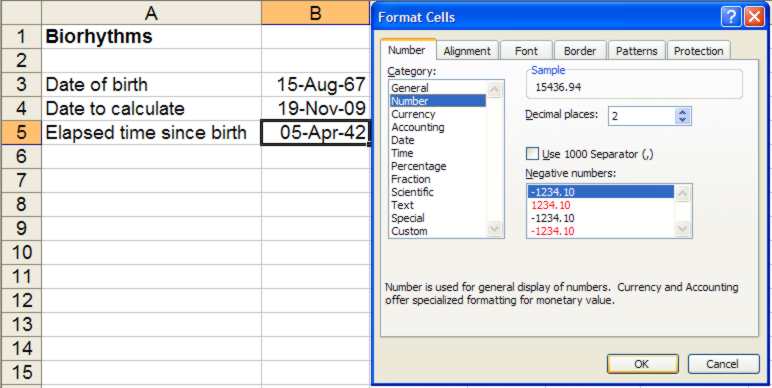
The elapsed time since birth is, of course, the difference in days (and fractions of days as we are using time of day to achieve more precision) between the date and time of birth and the current time. While this would be an impossibly difficult calculation to do by hand all we need to is a simple subtraction in B5: =B4-B3 The result initially looks surprising as it will be displayed not as a number but as a date and time.
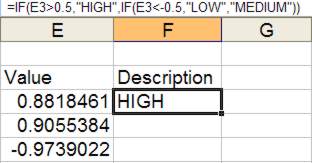
To remedy this requires cell B5 to be set to show a number. To do this right-click on the cell, select Format Cells from the pop-up menu and in the Number tab choose Number from the Category list with 2 decimal paces if you are interested in the knowing the fractional part of the time difference. (As this is a decimal fraction 0.5 corresponds to 12 hours and 0.1 to 2 hours 24 minutes). As well as the result in B5, the biorhythms calculations use two mathematical functions - the =SIN function to calculate sine values corresponding to the time elapsed since the date of birth and the =PI function to convert this to an angular frequency by multiplying by 2PI. The formula for each of the biorhythms cycles divides B5 by the number of days in the cycle, which we have entered in column D. The first of them can be entered in E3 as: =SIN($B$5/D3*2*PI()) Notice the use of an absolute reference in this formula. Instead of B5 it appears with two dollar signs. You can type these in but if you enter the cell reference by selecting the cell it is easier to click once on the F4 function key which converts a normal (relative) cell reference into an absolute (i.e. fixed) one. The advantage of going to the trouble of specifying the reference as absolute is that you copy this formula into E4 and E5. The values you obtain for Physical, Emotional and Intellectual are numbers in the range –1 to +1 – and are not very informative. You can make the spreadsheet easier to interpret by adding comments that take advantage of the =IF function, one of the most useful of all spreadsheet functions. In general terms, an =IF lets you specify different outcomes for different conditions. A simple IF handles two outcomes – what happens if something is true and an alternative that holds otherwise. By nesting one IF within another you can of course handle more possibilities. The following formula, to be entered into F3, splits the range into LOW (a value below -0.5), HIGH (a value above 0.5), and MEDIUM (0.5 to -0.5 inclusive). =IF(E3>0.5,"HIGH",
Notice the need to enclose the text messages in double quotes. You can copy this formula to F4 and F5. You might like to divide the range into five or even seven categories instead of just three with comments such as TERRIFIC, REALLY GOOD, PRETTY GOOD, MEDIUM, PRETTY BAD, REALLY DREADFUL and ABYSMAL – but be warned splitting an IF statement like this is hard work. <ASIN:1568840500> <ASIN:1859060323> |
|||
| Last Updated ( Friday, 16 April 2010 ) |


