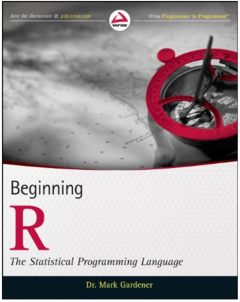
| Beginning R: The Statistical Programming Language |
Author: Mark Gardener R is an important language - but do you learn statistics or programming to make use of it? The answer is, of course, both. You can't use a statistical programming language unless you know both statistics and programming. So what should a book called Beginning R assume you know? It starts off by explaining how to get R, install it and start using it. Chapter 2 is where things really get started with a look at how to use R in calculator mode. The way that variables are introduced might cause some experienced programmers a problem. On page 29 we have object.name = mathematical.expression If you are familiar with object property notation this is going to look strange to you and suggest that variables are all object properties and expressions are all methods of a mathematical object. This isn't the intention. The dot is used in place of camel case or underscore: object_name = mathematical_expression. The problem is that while R jargon tends to refer to all data structures as objects and it does use multi-part names, e.g. read.csv for functions it isn't object oriented in the usual sense of the word. What this means is that using dots in definitions of terms is going to be very misleading to any programmer.
In fact the book really isn't aimed at the programmer. What it consists of is a collection of introductions to how to get standard statistics computed using R. No real explanations fo the statistical ideas or principles are provided and so you probably need to be reasonably familiar with the techniques to understand what is going on. One of the main challenges for the statistician in using R is getting the data into the correct format. The majority of chapter 2 is about reading in data. Chapter 3 is called "Starting Out: Working With Objects". Again it isn't really about objects as any programmer would recognize them - this is about data objects, vectors, lists, matrices and so on. For me it doesn't really provide the sort of structured explanation that would help me understand the data types that R supports - what is the difference between a matrix and a data frame for example? If you read the entire chapter you will get the idea but it would have been nice to have a clear and short summary.
Chapter 4 moves on to look at the task of computing descriptive statistics. This is a simple introduction to computing means, standard deviations and the usual topics of elementary statistics. Later it moves on to look at cross-tabulation. I'm not entirely sure of the value of this sort of introduction as you basically end up saying - to compute a mean use mean(x) - and this is fairly obvious and can easily be looked up. Chapter 5 is about distributions - creating simple plots and using density functions and so on. Chapter 6 moves on to hypothesis testing starting with Student's T and then the familiar non-parametric equivalent the U test. Next we have a look a correlation and co-variance which is in this chapter because we look at testing its significance. The chapter finished with the chi squared test for categorical data. It might have been better to group the material according to data type and analysis rather than lumping it all together under "hypothesis testing". A chapter on categorical data could have introduced cross-tabulation and chi-squared testing in one handy location. Chapter 7 returns to a simpler topic of charts - box-whisker plots, scatter plots, line charts and so on . Chapter 8 returns to more difficult topics with a look at "complex statistics" by which is meant the linear model in the form of Anova. The chapter starts out by explaining or almost explaining "formula" syntax. This is a way of describing the linear model you are fitting so y ~ A + B +A:B describes a complete two way Anova with two main effects and an interaction term. This isn't explained at all well in the chapter and to notice what it going on you need to be sure you understand Anova as a linear model. A two way Anova with interaction term is about as complicated as the book gets but there is a summary table at the end which explains how to write nested models. Chapter 8 is about data manipulation including adding replication labels and aggregation. Chapter 9 moves back to statistics with a look at regression. After simple regression the connection between Anova and regression - they are both linear models - is made and the formula syntax is summarized again. The chapter finishes with a look at stepwise regression and confidence intervals etc. The book closes with a chapter on more advanced graphic and finally a chapter on writing your own scripts. The chapter on scripts hardly gets off the ground - you learn how to write your own functions and that's about it. This is a book that has nothing much to offer the programmer because it hardly deals with the R language and what it does cover isn't explained in a form that would make it easy for a programmer to pick it up. The book also doesn't do anything much about explaining the statistics, so don't rely on it if you are statistics beginner seeking guidance about how to get a project completed. It also is fairly weak on a systematic look at data transformations. Most statistical analysis follows the 90-10 rule - you spend 90% of your time getting the data into the correct form and 10% of the time analyzing it. At best this book provides a lot of worked examples and if this is what you are looking for then by all means get a copy - but check out the R documentation first.
|
|||
| Last Updated ( Monday, 26 August 2013 ) |


