| New developer tools in Chrome |
| Monday, 28 February 2011 | |||
|
Chrome has some extra tools that make life easier for hard pressed developers.
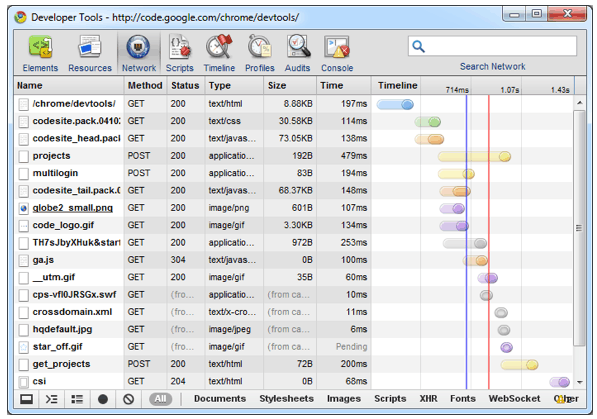
Developers writing for the Google Chrome web browser can make use of extra features, according to Google’s Chromium Blog. The Google Chrome Developer Tools give developers an integrated environment for debugging and optimising websites and web apps running in Google Chrome. The tools have been developed partly through the WebKit open source project, where the tools are called Web Inspector. The improvements (which are available in Chrome 9) start with better information about the network aspects of web pages. You can now see all the network information in the Network panel, and can sort and clear data, save information about navigation from the log, and export network data into HAR format. Timing information should be more accurate thanks to a change where the info is pulled from the network stack rather than WebKit, and you can view detailed timing for different phases of the loading by hovering over the log entry in a similar way to that provided if you use the Firebug plug-in for Firefox. Raw HTTP headers and status messages are also being made available in the Chrome Developer Tools, so you can see exactly what the browser received from the server rather than the details as interpreted by the rendering engine.
CSS support has been strengthened with better editing options and autocomplete, and the CSS sidebar has also been changed to show the raw information that the browser gets from the server, which should help with problems caused by WebKit not recognising CSS properties. Prior to the upgrade, the sidebar showed only the style content that the browser understood. If the browser didn’t understand the content, be it a typo or an unsupported property, the Web Inspector would show nothing, which sometimes meant that you spent time setting up something complicated and sophisticated only to see it disappear when you pressed Return, simply because you’d spelt something wrongly. What happens now is that the Web Inspector shows all the declared properties, and if the browser does not understand a property name or value then the property is shown with an exclamation mark next to its name, so you can put things right.
Find out more about Chrome Developer Tools at the tools homepage. Related news:Chrome Web store - another way to sell widgets 
|
|||
| Last Updated ( Monday, 28 February 2011 ) |