| Deep Monitor Your Site |
| Written by Ian Elliot | |||
| Thursday, 08 May 2014 | |||
Page 2 of 2
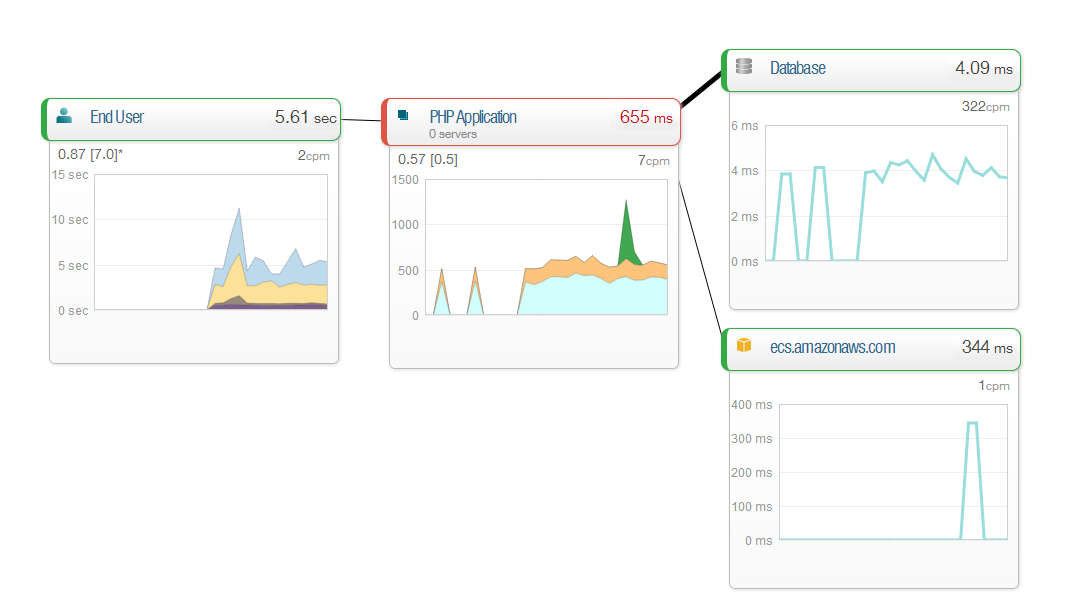
ExploringFrom the Overview page you can start to explore the information that your five minutes of earlier work has unlocked. Exactly what you find useful depends on the website and what you want to do. This said the Database tab is probably worth a visit by everyone; unless your website doesn't make use of a database, that is. This page provides a list of database operations ranked with most time consuming at the top of the list. In my case this confirmed my suspicion that the most common operation was content retrieval, but the fine detail was interesting and could be used to fine tune the code in the future. The charts of database throughput and response time also hold a longer term interest. The Map is also a very informative display showing you where the time to serve your page is spent:
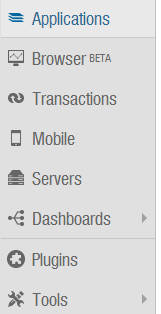
More MonitoringEven once you have explored some of the data in the Applications section there are other complete sections and other types of monitoring to be explored listed in the lefthand panel - I will explore some of these options in another article, but it is worth just outlining what is on offer.
The Browser option provides information on what browsers are accessing your application and if you enable some of the features that are currently in beta you can see information on Ajax operations, and JavaScript errors. In the Transactions section you can setup key transactions such as logon, signups, shopping basket access and so on. The Mobile section lets you monitor mobile apps and this is another story. The servers section lets you monitor the server in detail, CPU, disk use, load and so on. This involves installing another agent, but again as long as you have a reasonably standard setup it takes only a few minutes per server. The dashboard section is for creating custom dashboards so you can see the information that you have decided is important in one look. The plugins section contains lots of extensions that you can use to monitor specific services, such as MySQL, Microsoft SQL Sever, MongoDB and so on. The interesting thing is that you can create your own plugins. If there is something that isn't supported, or if you just think you can do the job better, then you can spend time writing code after all. Where Next?That's about it, there are some tools as well that you can use to view your alert history and other details of how things work, but overall the message is that this is a very rich monitoring system with lots of scope for configuration. It is useful for day-to-day management of the system and for finding out if your architecture is up to the proposed job. It does provide insights that are otherwise difficult to obtain. So how much does it all cost? Well the good news is that if you can live within the Lite option it is free forever. The biggest drawback is that Lite only keeps the data for 24 hours, but it is enough for you to find out if it is supplying useful data. If it is then you can move up to one of a number of plans, including the Pro at $149 per month.
To be informed about new articles on I Programmer, install the I Programmer Toolbar, subscribe to the RSS feed, follow us on, Twitter, Facebook, Google+ or Linkedin, or sign up for our weekly newsletter.
More InformationRelated ArticlesGetting Started With Azure Linux VMs The Appliance of...Virtual Machines
Comments
or email your comment to: comments@i-programmer.info
|
|||
| Last Updated ( Thursday, 08 May 2014 ) |