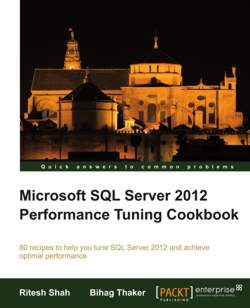
| Microsoft SQL Server 2012 Performance Tuning Cookbook |
Page 1 of 3
Author: Ritesh Shah and Bihag Thaker
Each recipe in this collection is largely self-contained, making it easy to provide a targeted approach. This is good if you know what you’re looking for, but often when you’re starting out, you don’t. Experience helps, so does reading the whole book. Each chapter starts with a short introduction to the topic, and contains between three and eight recipes. Each recipe contains sections for:
Most recipes are run against the freely downloadable Adventure Works 2012 database, this makes it easy to follow along with the recipes yourself.
Below is a chapter-by-chapter exploration of the topics covered. Chapter 1 Mastering SQL Trace Using Profiler Although SQL Server Profiler is deprecated, meaning it will be removed from future versions of SQL Server, it is a well known and much used tool for troubleshooting problems. The recipes here walk you through setting up a trace, filtering events, and detecting slow queries – all via the GUI. Additionally, the T-SQL equivalent is also provided. Overall the chapter is easy to read, explains things very well, with more than enough detail to get you started troubleshooting database problems. Chapter 2 Tuning with Database Engine Tuning Advisor The Database Engine Tuning Advisor (DTA) is a great tool for determining what indexes/partitions/statistics your queries need to run faster. It has the advantage over the missing indexes DMVs (see later) in that it considers the overall cost of both SELECTS and modifications (DELETES/UPDATES/INSERTS) in determining if an index should be created. The chapter shows you how to use the DTA to determine if a single query or indeed a whole SQL workload can be improved by adding indexes. There’s a good overview of the various DTA options and considerations needed to understand its output (e.g. the recommendations are only as good as the workfile contents). The use of DTA via the command line is also shown. I would have expected the new 2012 feature of using the plan cache as input to DTA to have been shown. It’s a much-welcomed feature but missing from this book. This chapter, in particular, was spoilt by bad grammar. For example “DTA can analyze workload or even a single query but analyzing a workload is one of the famous ways in DTA because a properly created workload has all different queries that we use to execute in the database, and wide range of query helps DTA to make good decision, based on the workload provided“
Chapter 3 System Statistical Functions, Stored Procedures, and the DBCC SQL PERF Command This awkwardly titled chapter discusses a miscellany of system features that help with monitoring. The features discussed include various system functions (e.g. @@connections), system stored procedures (e.g. sp_who2), and the DBCC SQLPERF command. Many of these features have been superseded by Dynamic Management Views/Functions (DMVs/DMFs), but they’re still widely used within the SQL Server community. There are useful scripts here to periodically collect and store values from each of these system features. There’s also a good discussion of the meaning of the various function columns. I was surprised there was no mention of sp_who2 being used to detect blocking. Overall this is a useful background chapter. Chapter 4 Resource Monitor and Performance Monitor Sometimes you need to go outside SQL Server to monitor resources at the Windows level. This chapter shows how to monitor CPU and memory usage using the Resource Monitor, Performance Monitor and Reliability Monitor. The chapter starts by examining the well known and basic Windows Task Manager, and progresses to the Resource Monitor to monitor CPU, memory, I/O and the network. There are recipes showing how to use Performance Monitor (PerfMon) to monitor CPU and memory usage. There’s a good explanation of the various PerfMon counters, and the correlation of SQL Profile output and PerfMon counters is illustrated. Although not mentioned, the DMV sys.dm_os_ring_buffers can also be used to monitor CPU performance, of both SQL Server and non-SQL Server processes, it contains CPU usage details, taken at 1 minute intervals, for the previous 256 minutes. Chapter 5 Monitoring with Execution Plans SQL Server makes decisions on how SQL queries should be executed, this information is reflected in the execution plan. Examining the execution plan should provide an insight into how SQL is working, together with an opportunity to make improvements (e.g. a missing index may have been identified in the plan). The chapter shows how to examine both an estimated and actual query plan, both graphically and using SET SHOWPLAN_XML (useful if the plan is large). Performance metrics are garnered using SET STATISTICS IO, SET STATISTICS TIME and Client Statistics. Again this chapter contains some noticeably bad English usage: “An execution plan is one of the most important feature shipped with SQL Server since long.” Overall, the chapter explains how and why execution plans are useful in monitoring, and how they might be used to get hints to improve performance. Chapter 6 Tuning with Execution Plans This chapter extends the previous one, showing how execution plans can be used to improve performance. Topics discussed include join types (hash, merge, and nested loop), table/index scans, and key lookups. Each topic is explained in terms of why it might be bad, and how it can be improved. Overall the chapter is useful and interesting, if a little small. <ASIN:1849685746> |
||||
| Last Updated ( Monday, 28 October 2013 ) |

