| Code Digger Finds The Values That Break Your Code |
| Written by Mike James | |||
| Thursday, 25 April 2013 | |||
|
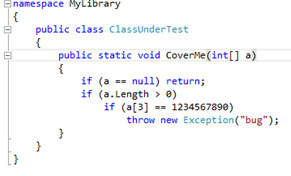
Code Digger is a free extension for VS 2012 that will automatically find "interesting" input values for your program - where interesting usually means "crash" or otherwise break your code. I had a colleague with a remarkable talent. He could look at your program for a few minutes, go to the keyboard and enter something that would crash it. It was a valuable knack, but guess what, he was hated for it. Not a gift you would wish on anyone. Now you don't have to. Code Digger is a lightweight Visual Studio extension that will examine your code and perform the same trick. It makes use of the Pex engine and Microsoft' Research's Z3 constraint solver to analyze all branches in the code in an attempt to generate a test suite that runs the code though all possibilities. The input values needed to exercise your code in this way are the "interesting" values that your code either copes with or dies on.
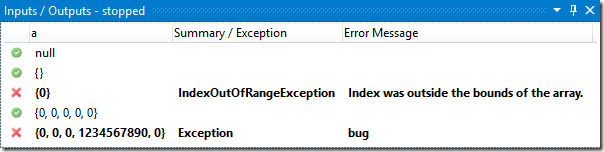
Code Digger takes the code and makes a list of the interesting input values along with their outputs and shows you if any make your program crash along with the error message:
At the moment there are some limitations. In particular it only works with a Portable Class Library. The reason for this is that it cannot cope with platform specific dependencies.
Code Digger is essentially an easier to use form of Pex which does performs a more configurable analysis. If you want to try Pex there is a website where it will analyze your code interactively. It also has a set of programming puzzles where you try to write code the matches the Pex analysis of a hidden function. It's fun and it emphasizes the idea that a program is well defined by a small number of input output relationships.
More InformationIntroducing: Code Digger, an extension for VS2012 Related ArticlesDebugging and the Experimental Method Chrome Native Debugger For Visual Studio Does Your JavaScript Leak? Introducing Google Leak Finder Debug the easy way with Canvas To be informed about new articles on I Programmer, install the I Programmer Toolbar, subscribe to the RSS feed, follow us on, Twitter, Facebook, Google+ or Linkedin, or sign up for our weekly newsletter.
Comments
or email your comment to: comments@i-programmer.info

|
|||
| Last Updated ( Thursday, 25 April 2013 ) |