| The First Things I Look At On A SQL Server – Part 1 |
| Written by Ian Stirk | |||
| Monday, 24 June 2013 | |||
Page 1 of 2 I’m often called upon to investigate problems with an unfamiliar SQL Server database. So I need to gather information about the server and its databases quickly. With this in mind, I have a set of scripts that I typically run, and I’ll share these with you here.
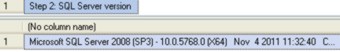
The scripts relating to this article can be downloaded from the CodeBin and you can see the entire code in a separate window by clicking - Display Code. Rather than describe the code in depth, I’ll describe its purpose and meaning. Where possible the script contains comments on what to look out for. Please note, the script uses Dynamic Management Views (DMVs), so you will need View Server State permission to access these. Additionally system tables are also used. The script assumes SQL Server 2005 or higher. Each step of the script is described below. Step 1: DateTime of run This step shows the date and time the script was run, which is useful for reference purposes. The SQL simply formats the GetDate() function. Step 2: SQL Server version Running the command SELECT @@Version shows details of the version of SQL Server installed on the box, including:
An example of the SQL Server version information on my server is given below:
The output can be used to determine the capabilities of the SQL Server you are using. You can check you are running the correct version of SQL Server, with the correct service pack, and do the same for the Windows version too. Step 3: Property info about server instance It is possible to access the various SQL Server “server properties” using the command
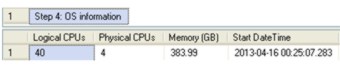
The ServerName, InstanceName, and MachineName are useful for identifying the machine. The Edition tells you the capabilities of the SQL Server edition, for example only the enterprise edition has the ability to compress. The ProductVersion and ProductLevel identify the specific version of SQL Server and its service pack level. This can be useful in determining if the correct version of SQL Server and its service pack has been installed. The IsIntegratedSecurityOnly value tells you if server authentication is via Windows only (generally the preferred method) or via both SQL Server and Windows. The IsClustered value tells you if the SQL Server is clustered, a very important consideration for disaster recovery. Step 4: OS information Knowing about the hardware capabilities of the box that SQL Server is running on allows you to make some judgements about the ability of the box to process a workload, it’s also useful for comparing servers. The DMV called sys.dm_os_sys_info is used to obtain the OS information. The script will show you:
An example of the OS information on my server is given below:
The amount of memory the server has is not necessarily the amount of memory the SQL Server instance has, to determine this you need to look at the max server memory (MB) , this is given in Step 5: Configuration - specifics. The data returned by the DMVs in the scripts in this article, have typically been accumulated since the last time the machine was rebooted, so knowing this date and time is important. Step 5: Configuration - specifics There are some common server configuration settings that have a big impact on the processing of SQL queries. The catalog view called sys.configurations is used to obtain this specific configuration information. The specific configuration options examined are:
An example of these configuration settings on my server is given below:
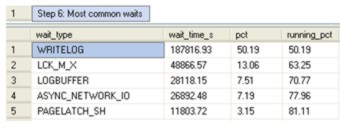
(click on image to enlarge) If you use .NET code within your SQL Server, the ‘clr enable’ value is set to 1. This tells you about the processing happening on the box (i.e. is it limited to T-SQL or does it extend to C# etc). Having multiple CPUs on your box means it is possible to run a long running query over several CPUs. The ‘max degree of parallelism’ (MAXDOP) and ‘cost threshold for parallelism’ are typically used together to control how much parallelism is allowed (MAXDOP), and how long a query is expected to run before we should use parallel processing. On servers with a high reporting workload, a high MAXDOP value is typically used, whereas on transactional biased servers a low value is typically used. A conundrum occurs when you have a large amount of both reporting and transactional workloads on the same server, what values should you choose?! I’ve often found a MAXDOP of 8 and a ‘cost threshold for parallelism’ of 30 to be good for mixed workloads. Ideally you should perform tests to identify the correct values for your own workload. The ‘max server memory (MB)’ value tells you how much of the server’s memory (we know this from Step 4: OS information) has been assigned to SQL Server. Remember some memory needs to be left for other processes. I’ve seen cases where the server memory has been increased, but the amount of memory assigned to SQL Server hasn’t, resulting in no improvement in the system! Please remember you need to change this setting too when you add more memory to the server. When SQL is run, a query plan is often created for reuse. These plans save time and CPU when the query is subsequently run. However query plans take up space, and if many queries are run only once, this space is wasted. The setting ‘optimize for ad hoc workloads’ ensures that SQL creates and stores a full query plan only if it is used at least twice, thus saving memory. Priority boost tells you if SQL Server is running at a higher scheduling priority, thus aiming to improve performance. Note, this setting needs careful testing, I’ve known it to cause instability on systems, also note it will be removed from future editions of SQL Server. Step 6: Most common waits Your submitted SQL tends to be running on the CPUs or waiting for something, and waiting reduces performance. If your SQL is waiting, SQL Server records the reason why it is waiting. The DMV called sys.dm_os_wait_stats can be used to identify the main reasons why the SQL on your SQL Server has been waiting. Knowing why your SQL is waiting allows you to take steps to correct this, and improve performance. In the script, some types of waits are innocuous, and these are filtered out of the results. The waits are sorted by order of importance. An example of the common waits on my server is given below:
There is a popular article on MSDN by Tom Davidson (http://msdn.microsoft.com/en-us/library/cc966413.aspx), where he discusses the meaning of the most common wait types, and how they can be reduced – this article should be used to help reduce your waits. |
|||
| Last Updated ( Tuesday, 06 August 2013 ) |