| Creating The Python UI With Tkinter - The Canvas Widget |
| Written by Mike James | ||||
| Thursday, 23 April 2020 | ||||
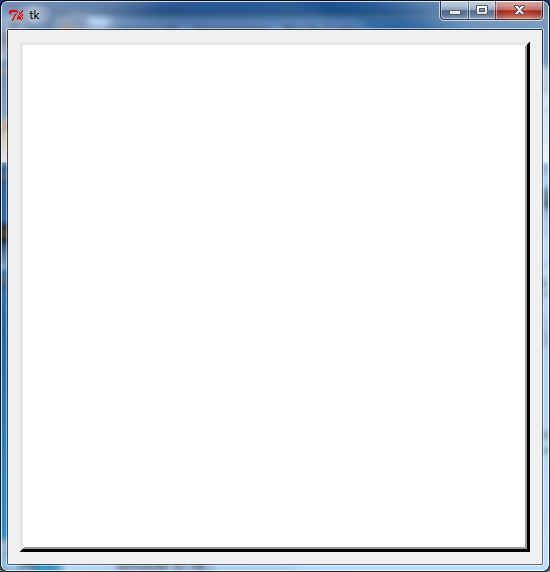
Page 1 of 3 The most powerful of the Tkinter widgets is the canvas. You can use it to create general graphics and it can be used to create custom widgets. It's worth knowing about. The canvas widget is "just another widget" and in this sense you already know quite a lot about how to use it, but there a few specifics that make it more than "just a widget". The canvas widget can be added to a suitable container often the root window in the usual way. For example the simplest canvas setup program you can imagine is:
This creates a canvas widget 500x500 pixels and sizes the root window to fit. You can also add a border to the canvas, but there is one small problem - it sits inside the canvas coordinate system which means you can't draw in the space it occupies. The best solution is don't use a border but place the canvas in a frame and give the frame a boarder. An alternative is to move the co-ordinate system by the size of the border - more about this later. For now to create a canvas without a border or anything that obscures the edges of the coordinate system use:
As an example of a canvas with a border and some padding try:
The next question we have to answer is how to draw on a canvas but first it helps to understand the general approach that the widget uses to graphics. A Retained Vector Drawing systemDon't get the Tkinter canvas widget confused with the HTML5 canvas element - because they work in completely different ways. The canvas widget works with vector graphics and in a retained mode. That is you draw on the canvas widget by specifying graphics primitives like circles or rectangles and the canvas stores the commands in a display list. When the time comes to redraw the display the canvas processes the display list and draws the shapes onto a bitmap which is then copied to the screen. What this means is that what you draw to the canvas is retained between redraws and you don't have to explicitly redraw everything each time the window is obscured - this is usually called retained mode graphics. It also means that the details of the objects that you draw are available to the canvas widget and it can handle updates to their attributes, color, position and so on and it can bind events to them. This is what makes the canvas not just a way of creating general purpose graphics but also a way to create new widgets. Graphics object also have a drawing order which can be used to place one object in front of another. If you are more familiar with pixel based bitmap graphics then this approach and the way it works will seem strange at first but it has big advantages. However it does have the disadvantage of being potentially slow. Keeping track of the display list and having to process it every time a redraw is required can be time consuming. To try to speed things up the canvas widget uses a "dirty" rectangle which marks out the smallest area of the display that has to be redraw and it only redraws objects within this area. Even so if you fill a canvas with a lot of graphics objects it can slow down to become unacceptable. The only solution in this case is to limit the total number of objects which have to be redrawn. Usually this can be done by clearing the canvas of all objects:
and then redrawing only the objects that are current. Another standard canvas pattern is to avoid drawing new objects but to reuse objects that have already been drawn. For example if you want to draw a moving graph then using bitmap graphics the usual method is to just keep plotting points but this would eventually overwhelm the canvas display list. In this case you should draw the number of points needed and simply move them around the screen to create the animated curve. Drawing A RectangleThe simplest drawing command that can be used to illustrate these ideas is the rectangle. The canvas method
will draw a rectangle at the given bounding box i.e. the coordinates of the top left-hand and bottom right-hand corner using the specified options. For example to draw an outline of a rectangle with top left-hand corner at 0,0 and bottom right-hand corner at 10,10 you would use:
The coordinate system within the canvas has 0,0 at the top left, x increases to the right and y increases down the screen. More about co-ordinate systems later. If you run the program you will see a rectangle but there is more to it than meets the idea. This is a retained system and the rectangle that you have just drawn is an object contained by the canvas widget. When you create a graphics object the method returns an id that you can use to refer to the graphics object again. There are a range of different methods that can make use of the id to modify the graphics object. For example the coords method can be used to set the coordinates of the object. In most cases you have to specify four coordinates for the bounding box. If you don't specify new co-ordinates then it returns the current co-ordinates. So to move the rectangle we created earlier to a new location you might use:
which first creates the rectangle at 0,0 and then moves it to 100,100. If you want to move the rectangle from its current position to a new one displaced by Dx,Dy then you can use something like:
<ASIN:0596158068> <ASIN:1449382673> |
||||
| Last Updated ( Thursday, 23 April 2020 ) |
