| What is a Gantt chart? |
| Written by Andrew Johnson | |||
| Monday, 28 March 2011 | |||
Page 1 of 2 More than just a chart, a Gantt Chart is a UI used to model tasks with interdependencies to show how a project fits together. A Gantt chart control not only gives you an easy way of constructing a model but can actually do some planning for you.
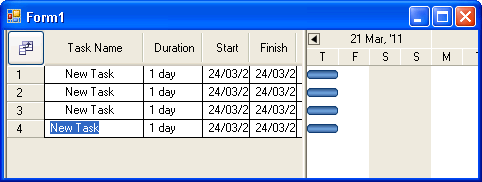
Sometimes you have to ask a simple question to get a simple answer. In most cases what a chart component does is fairly obvious but sometimes they can be a bit more mysterious. Even looking at examples only clarifies how the control can be used in specific cases not the general principles. So it is with the Gantt chart. It has an odd name and when you look at a typical example it can be difficult to see what is going on. In practice the Gantt chart isn't complicated and once you know what it is all about a range of non-standard applications open up. In this article we look at the Gantt chart in general and to make things concrete we will use the Infragistics Gantt chart component. After you have seen how it all works you can contemplate creating your own component but you will also be in a good position to estimate how difficult the task might be, Download a free trial evaluation of the Windows Forms controls from the Infragistics site. Install it and open a copy of Visual Studio and start a new Windows Forms project. Place a single UltragantView control on the form and size the form so that you can see all of the control. A Gantt chart is simply a plot of start and end times. Each horizontal bar indicates a start date, end date and hence a duration.To add a bar simply run the program, yes you don't need to add any code, and right click on the Gantt control and select Insert task - and few while you are at it.
You can see that each bar can represent a task or activity. By dragging it left or right you change when the task happens without changing its duration. By dragging either the start or end dates you change how long the task takes.
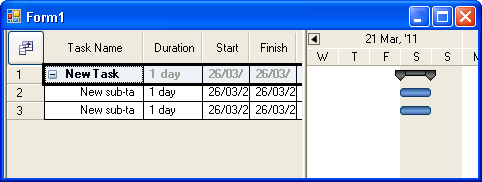
A set of horizontal bars can be considered to make up a project consisting of tasks. Adding dependencySo that's it. A Gantt chart is a set of bars indicating the timing and duration of tasks that make up a project. Consider for a moment a task. In most cases it will be composed of other sub-tasks which have to be completed in some sort of order before the entire task is completed. You can use a Gantt chart to model this. Start with a single task and right click on the Gantt control. Select Add Sub task and do this twice. Now you have a task that is composed of two sub-tasks and you can see that the way that the top level task is drawn has changed.
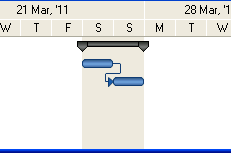
In the default form the subtasks appear to occupy the same time slot and they are assumed to run in parallel. However if the first subtask has to be complete before the second then we have a more interesting model. To set this up right click on the second task and select Task Information, click on the Predecessors tab and enter the row number of the task that has to be completed before this task starts - row 2 in this example.
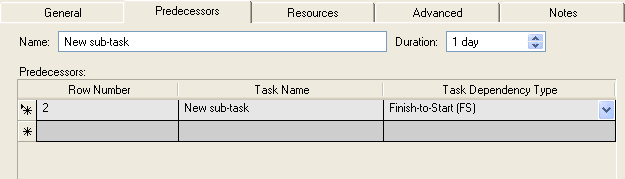
You also need to select Finish to Start or FS relationship. If you do this you will see the new Gantt chart now shows a task that takes as long as the two sub-tasks task to complete one after another - the Gantt chart has already worked something out from the model you are building.
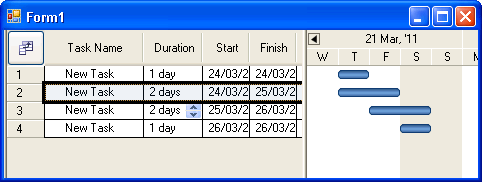
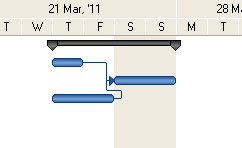
This is a general principle. If you add multiple subtasks and link them together so that the start time of a given subtask depends on the finish time of a set of subtasks then that task will only start when the final subtask is complete. For example:
In this case the first subtask is complete after one day but the third subtask now takes two days and so the second subtask cannot start until then. Notice that once again this is worked out for you by the Gantt control. However if you enter data into any of the fields then your entered values take precedence. To see the natural computed values for a field simply clear it. |
|||
| Last Updated ( Monday, 28 March 2011 ) |