| Grafana 7 Adds New Visualizations |
| Written by Kay Ewbank | |||
| Monday, 08 June 2020 | |||
|
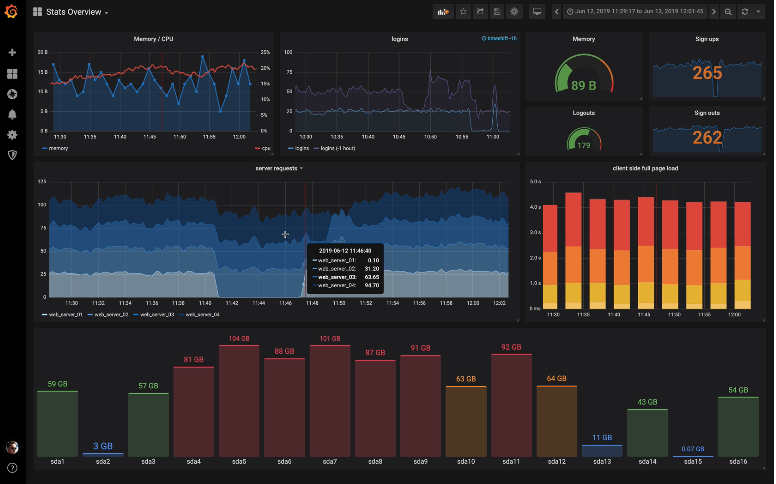
Grafana, an open-source metrics analytics & visualization suite, has been updated with a major new version that has a new plugin architecture, more visualizations and transformations, and native trace support. Grafana is often used alongside Prometheus, an open-source monitoring and alerting system. The pairing provide a robust time-series database with a way to visualize the data that's been collected. Grafana was created as a fork of Elastic's Kibana (ElasticSearch’s analytics and visualization platform) to add support for monitoring metrics that was lacking at that point in Kibana. Amazon uses the open-source version of Elastic stack as their AWS Elasticsearch managed service.
Prometheus is a real-time, time-series database with a robust query language that lets you aggregate the data series to get a higher level view. Grafana can then be used to analyze and visualize the data. While it is often used with Prometheus, it also supports a wide range of data sources including Elasticsearch and InfluxDB. Grafana can be used to create and use charts, graphs, and alerts for the web from supported data sources, so that it's easy to identify potential problems with the device the data is drawn from. You can set up dashboards based on different data sources and metrics, showing data in charts with smart axis formats even when the time series is extensive.
Grafana has a good selection of client side graphs, including heatmaps and geomaps, and you can use panel plugins to extend the visualization options. Grafana can be used to explore data through ad-hoc queries and dynamic drilldown, with the ability to use split views to compare different time ranges, queries and data sources side by side. You can also set up alert rules for your most important metrics. Grafana will continuously evaluate and send notifications to systems like Slack, PagerDuty, VictorOps, and OpsGenie. The new release has improvements to the user interface and unified data model for better consistency and usability including a new table panel, and a new grid layout engine A new auto layout mode has been added to make it easier to resize panels for a variety of formats including tables, non-time-series data, and charts. Data visualizations are now based on specific data configurations for better consistency across Grafana. Transformations have also been improved so users can transform all types of data rather than just those being visualized. Support has been added for AWS CloudWatch logs, and enterprise users will be able to carry out usage and presence analytics. More InformationRelated ArticlesOpen Source Time Series Database Released Grimoire Lab-GitHub - Stats On Steroids New Amazon Elasticsearch Service To be informed about new articles on I Programmer, sign up for our weekly newsletter, subscribe to the RSS feed and follow us on Twitter, Facebook or Linkedin.
Comments
or email your comment to: comments@i-programmer.info |
|||
| Last Updated ( Tuesday, 09 June 2020 ) |


