| Getting started with .NET Charts |
| Written by Ian Elliot | |||
| Tuesday, 19 July 2011 | |||
Page 2 of 2
Data pointsMost of the time your data starts out life in a simpler data structure - an array, say. To draw a chart your first task is to get the data in Point form. For example to plot the x,y data contained in the arrays: int[] x = { 1, 2, 3 };
you would simply use a for loop to create a Point for each x,y value: for (int i = 0; i < x.Length; i++) Notice the way that dp is being used as a temporary reference to the new Point object. The Point objects aren't garbage collected because they are part of the collection and hence still have a reference to them. There are lots of ways of doing the same job and which one you choose is up to you. For example you can set the value of the Point in the constructor: DataPoint dp = new DataPoint(x[i],y[i]); Perhaps the simplest way of doing the job and the one that you see in use most often is to use the form of the Add method that creates a Point object on the fly: int[] x = { 1, 2, 3 };
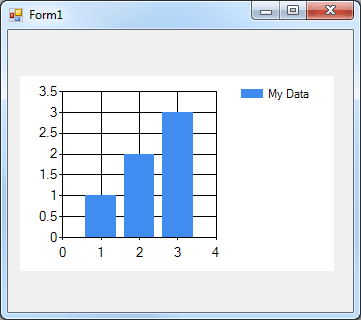
This is so much simpler you might be wondering why I have taken so long to introduce it? The reason is that while it is simple it covers up the fact that a Point object is being created and used. If you run the program as shown above the result is a still a simple histogram - the x values are ignored for this chart type.
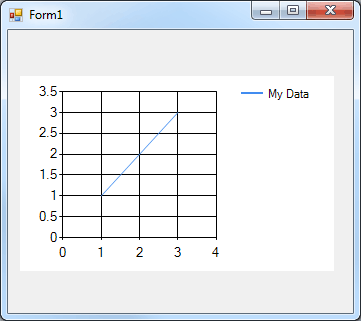
So how do you select the chart type? Simple once you know that each series can have its own chart type defined. All you have to do is set the ChartType property: chart1.Series["My Data"].ChartType = This selection plots a line chart.
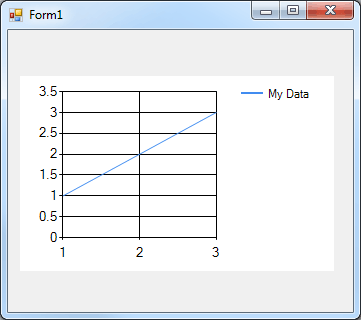
The next logical question is how do you control the axes? This takes us a little deeper into the way that the chart is organized. You can define multiple chart areas. Each area is a complete 2D plotting area that can be used to create a plot which may display multiple series. Each chart area has a set of axes that are used for the plot - a primary X and Y and a secondary X and Y axis. So how do you work with chart areas? The simple answer is that the is a ChartAreas collection with a single default ChartArea already added - but you can add more in the usual way (i.e. use the Add method). To determine which ChartArea a Series displays on you simply set the Series ChartArea property to the name of the ChartArea in the collection you want to use. For example to use the default ChartArea: chart1.Series["My Data"] = Of course you don't have to do this because it is setup this way by default. You can spend a lot of time exploring the ChartArea and its properties but one simple example of modifying the x axis should give you an idea of how it all works. For example to change the x axis to show a range of 1 to 3 you would use: ChartArea area=chart1.ChartAreas[0];
The ChartArea has lots of different objects like the Axis object that you can modify to change the nature of the plot. Now it is just a matter of exploring until you have the chart of your dreams. |
|||
| Last Updated ( Tuesday, 19 July 2011 ) |