| Looking at Chaos |
| Written by Mike James | |||
| Saturday, 05 September 2009 | |||
Page 2 of 2
The only problem with this sort of display is that it doesn’t really show you what the iteration is doing as the bifurcation proceeds. To do this we need to add another picturebox to plot the progress of the iteration for each value of a. Make the picturebox that you add as wide as you can. To make the plot look like a strip chart or oscilloscope display a Scroll extension method is added to the PictureBox class. See Stripchart Scrolling to find out how this all works. Add the following static class to the program: public static class MyExtensions [DllImport("user32.dll")]
and using System.Runtime.InteropServices; The complete new version of the Click event handler is: private void button1_Click( This simply plots the data as the bifurcation diagram is plotted. On most machines this works so quickly that it looks like a display on an oscilloscope.
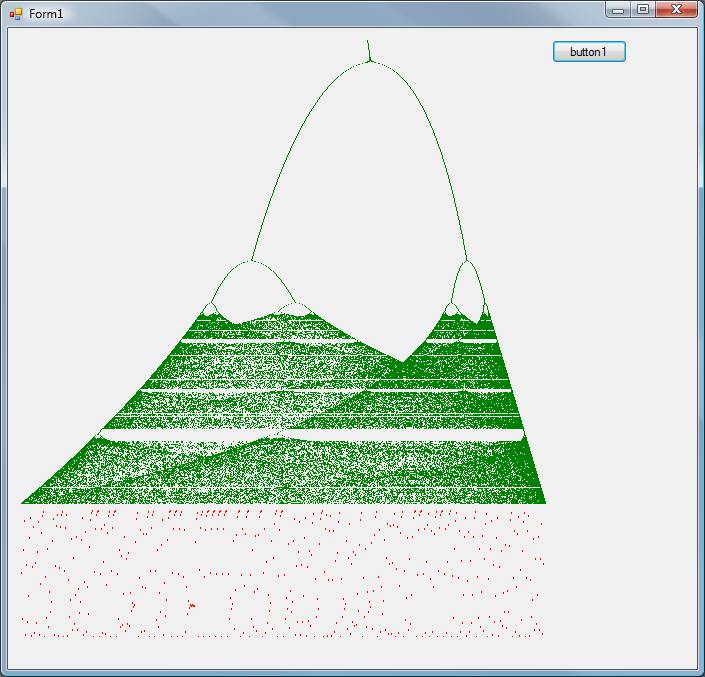
Bifurcation diagram with stripchart plot When you run the program notice the way that the population graph changes as additional stable points enter the bifurcation diagram. Also notice the way that the “signal” changes from periodic to what looks like random as the bifurcation diagram changes to chaos. You will need to watch the entire performance more than once because there is a lot to look at and take in. If you want to zoom in on a vertical section of the bifurcation diagram then change the 2.9 and 4 in the first instruction in the for loop. If you would like the code for this project then register and click on CodeBin. <ASIN:0143113453> <ASIN:0192853783> <ASIN:0786887214>
|
|||
| Last Updated ( Saturday, 05 September 2009 ) |