| Copilot Diagnostics Toolset for .NET In Visual Studio |
| Written by Kay Ewbank |
| Tuesday, 02 September 2025 |
|
Microsoft has added a new diagnostics toolset for .NET development in Visual Studio. The Copilot Diagnostics for .NET is integrated with GitHub Copilot and aims to cut out the repetitive, tedious work so you can focus on what really matters: solving problems and shipping features. The toolbox has a set of features aimed at making debugging faster, including suggestions and troubleshooting from Copilot on breakpoints and tracepoints; an IEnumerable Visualizer with Copilot-Assisted LINQ queries; and variable analysis.
The tools for breakpoints and tracepoints start with Copilot analyzing your current context and suggesting exact conditional expressions or tracepoint actions that target the right spot in your code. For existing problematic breakpoints, Copilot can troubleshoot non-binding breakpoints, walking you through the likely causes whether it’s mismatched symbols, incorrect build configurations, or optimized code paths. The tool then suggests how to fix the problem. There's also a new visualizer designed to let developers inspect massive collections without getting lost. The IEnumerable Visualizer renders data in a sortable, filterable tabular view, then Copilot can generate or refine LINQ queries based on natural language prompts. If there's a filter that isn't working, Copilot will create the LINQ code to identify the problematic rows. You can also use Copilot to explain LINQ statements. Hover over a LINQ statement while debugging and Copilot will explain what it’s doing, evaluate it in context, and highlight potential inefficiencies or logic mismatches.
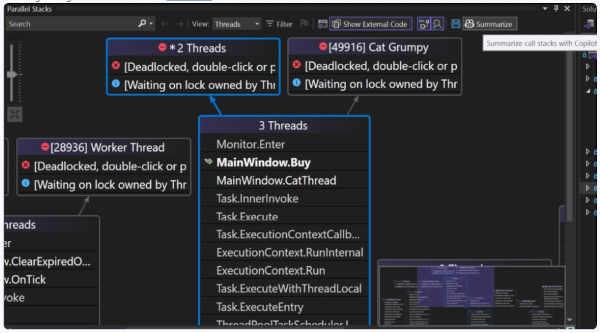
The toolbox also supports exception assistance with Copilot. This means Copilot summarizes the error, identifies the likely cause, and offers targeted code fix suggestions. The tool also lets users hover over a variable in DataTips, Autos, or Locals and click the Copilot icon to see the potential reasons for unexpected results. There's also an option for Return Value Analysis, which shows what your methods return inline, in your code while you debug. Copilot can then validate and provide explanations for these values in context. Finally, the toolbox provides parallel stacks deadlock analysis, auto summaries & insights. This can be used to untangle complex async and multithreaded code in the Parallel Stacks window. Copilot generates thread summaries for each stack, while its Summarize option provides insights for application state, possible deadlock, hangs and crashes so you can diagnose issues without combing through hundreds of frames. The new toolbox is available now.
More InformationCopilot Debugging Toolkit Documentation Related ArticlesGitHub Copilot Adds VSCode Agent Mode Microsoft Adds Copilot Key To Windows To be informed about new articles on I Programmer, sign up for our weekly newsletter, subscribe to the RSS feed and follow us on Twitter, Facebook or Linkedin. 
Comments
or email your comment to: comments@i-programmer.info |