| Scientists, Data Scientists And Significance |
| Written by Mike James | |||
| Monday, 15 April 2019 | |||
Page 1 of 2 In a recent special issue of The American Statistician, scientists are urged to stop using the term "statistically significant". So what should we be using? Is this just ignorance triumphing over good practice? There are many who think that science is in a state of crisis of irreproducible, and even fraudulent, results. It is easy to point the finger at the recipe that statisticians have given us for "proving" that something is so. It is a bit of a surprise to discover that at least 43 statisticians (the number of papers in the special edition) are pointing the finger at themselves! However, it would be a mistake to think that statisticians are one happy family. There are the Frequentists and the Bayesians, to name but two warring factions. The problem really is that many statisticians are doubtful about what probability actually is. Many of them don't reason about probability any better than the average scientist and the average scientist is often lost and confused by the whole deal. If you are Frequentist then probability is, in principle, a measurable thing. If you want to know the probability that a coin will fall heads then you can toss it 10 times and get a rough answer, toss it 100 times and get a better answer, 1000 and get even better and so on. The law of large numbers ensures that, in the limit, you can know a probability as accurately as you like. Things start to not make sense when you apply probability to things that are just not repeatable. Hence the probability that there is life on other planets almost certainly isn't a probability - it's a belief. There are plenty of belief measures and systems that are close to probability, but probabilities they are not. SignificanceIf you already are sure you know how significance testing works jump to the next page. This brings us to the question of significance. How can you decide if an experiment has provided enough evidence for you to draw a conclusion? Surely an experiment isn't something you can apply a probability to? If you have a model for how the data that the experiment produces varies randomly then you can. For example, if the experiment is to "prove" that a coin isn't fair you can throw it 10 times and see what you get. Clearly, even if the coin is fair, it would be unlikely that you would get 5 heads and 5 tails. So you start off with the assumption that the coin is fair and work out how likely it is that you get the result that you got. Suppose you got 6 heads then the probability of getting that from a fair coin is about 0.2, which means you would see this result in 20% of the experiments with a fair coin. If you got 8 heads, the probability goes down to 0.04 and only 4% of your experiments would give you this result if the coin was fair. This isn't quite how things are done. To test if a coin is fair you need to setup a repeatable experiment that has a fixed probability of getting it wrong. So you need to set a limit on how many heads or tails you need to see to reject the hypothesis - the null hypothesis - that the coin is fair. If we toss a fair coin 50 times, we can fairly easily compute that the probability of seeing 18 or more heads (or 18 or more tails) is around 0.05 (it is 0.065 to be exact). So our experiment is to toss the coin 50 times and if you see 18 or more heads or tails then conclude the coin is biased. Clearly even if the coin is fair you will incorrectly conclude that it is biased about 5% of the time. This is the significance level of the experiment and it characterizes the Type I error - i.e. to reject the null hypothesis when it is true. Notice that this characterizes the experiment's quality and not any one outcome of the experiment. The particular results you get are not "significant at the 5% level"; it is the experiment which has a significance, a type I error, of 5%. It is the tool that is being quantified, not a particular use of the tool. So are you satisfied with a tool that is wrong 5% of the time? However, there is more to it than this. The most important additional idea is that of power. This is the other side of the significance coin - pun intended. Suppose for a moment that the coin was biased, then what is the probability that you would detect it with your experiment. The problem here is that this probability depends on how biased the coin is. Clearly if the probability of getting a head is 1.0, or close to 1, then we can expect to see ten heads in ten throws. As the bias gets less then the probability of seeing enough heads to reject the null hypothesis goes down. This probability is called the power of the test and it is the natural partner of the significance. Any experiment that you carry out has a measure of its quality in these two probabilities -
and
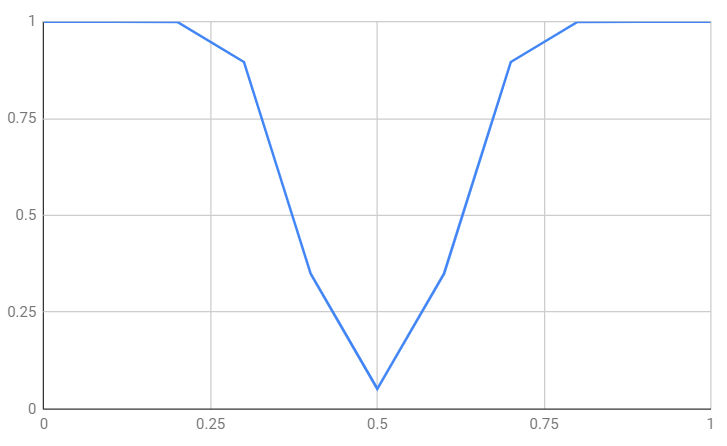
Clearly the power also depends on the level of significance you have selected. For example, if we work out the power for the probability of a head in increments of 0.1 and take a significance level of 0.05 then 18 or more heads/tails in 50 throws are what we need to reject the null hypothesis. The probability of getting at least 18 heads or tails can be seen below:
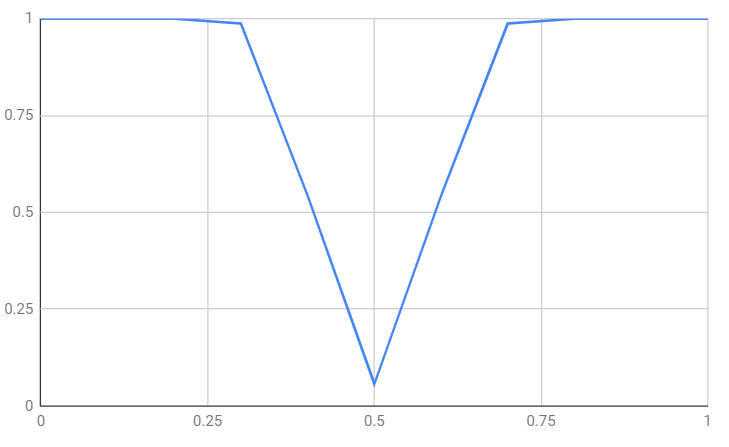
As the bias of the coin gets further away from 0.5 you can see that the probability of correctly rejecting the null hypothesis increases. What is more, as the sample size increases so does the power. This is perfectly reasonable as the bigger the sample the more sensitive the test is. For example, for a sample of 100 at the same significance level:
You can see that if the coin if biased as much as 0.25 or 0.75 then you are almost certain to detect it using this experiment. |
|||
| Last Updated ( Monday, 15 April 2019 ) |