| A Programmer's Guide to Canvas |
| Written by Ian Elliot | |||||||
| Thursday, 24 January 2019 | |||||||
Page 3 of 3
Active and passive viewThe transformation operations are all very easy but it is worth recalling that transformations have two completely different interpretations and uses.
Both views are useful when programming - lets take a look at an application of each in turn. The active view of transformation uses them to draw an graphics object at another location. For example to draw a rectangle at a different angle we could use:
This first moves the origin to 100,100 and then rotates by 45 degrees - the rectangle is now drawn with its top lefthand corner at 100,100 and rotated. Notice that this is not the same as rotating then translating - try it and see.
The passive view of the transformation simply changes the co-ordinate system and you just draw using the new co-ordinates. Now let's try a change in the co-ordinate system to make plotting a graph easy. In principle you could plot a sin function using:
However, if you try it you will just see a small splodge at the top of the canvas. The reason is, of course that the x value varies from 0 to about 12 and the y value varies between +1 and -1. You can use constants to scale and shift the graph to make it fit in with the current co-ordinate system if you want to. For example:
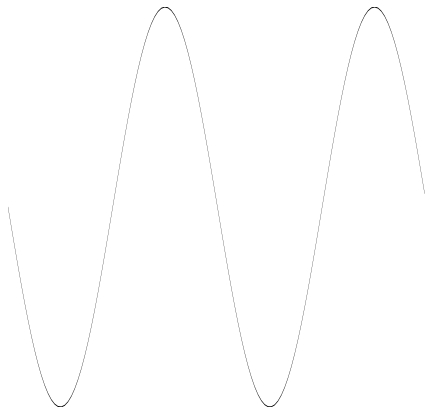
This produces a reasonable sine wave but a much cleaner method of plotting graphs is to make use of the transformation to provide the co-ordinates that we would really like to use. We would like a co-ordinate system that varied between 0 and 12 in the x direction and +1 and -1 in the y direction. If we assume that the canvas is 400x400 then the change in the co-ordinate system can be created using:
First we scale so that the x axis runs from 0 to 12 and the y axis from 0 to 2. Then we translate so the the y axis runs from -1 to 1. The only complication is that that the transformation affects every measured aspect of the drawing, including line width. So we have to reduce the line width back to roughly one pixel in expressed in the new co-ordinate system.
In general to create a co-ordinate system that runs from xmin to xmax and ymin to ymax with a canvas of size width by height you need to first perform a scaling :
followed by a translate:
Now available as a paperback or ebook from Amazon.JavaScript Bitmap Graphics
|


JavaScript Canvas - WebGL A 3D Cube It's a right of passage - you have to draw a 3D cube to prove you can! It also needs a deep understanding of WebGL. This extract from Ian Elliot's book on JavaScript Graphics looks at how to use [ ... ] |
JavaScript Data Structures - A Lisp-Like List JavaScript lets you do so much with so little as we show here by implementing a Lisp-like list data structure. |
Other Articles
|