| Moving to Excel 2010 |
| Written by Janet Swift | |||||
| Wednesday, 13 October 2010 | |||||
Page 3 of 4

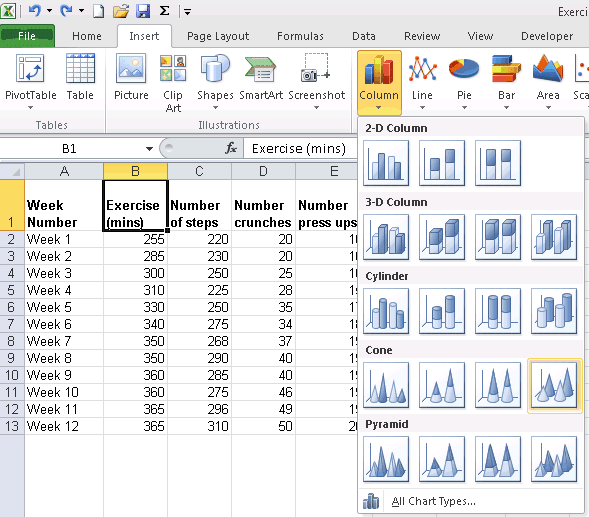
Instant chartNow we can continue to create a chart. To show how easy this can be, leave the cursor on B1 (which now contains the label Exercise (mins), click on the Insert tab and find the Charts section near the middle of ribbon and click on the down arrow below Column to view the options available for different variations of the familiar column chart.
Click on the 3-D Cone and the chart appears instantly complete with legend, using the labels in Row 1, and axis, using the labels in column A, which have been identified automatically.
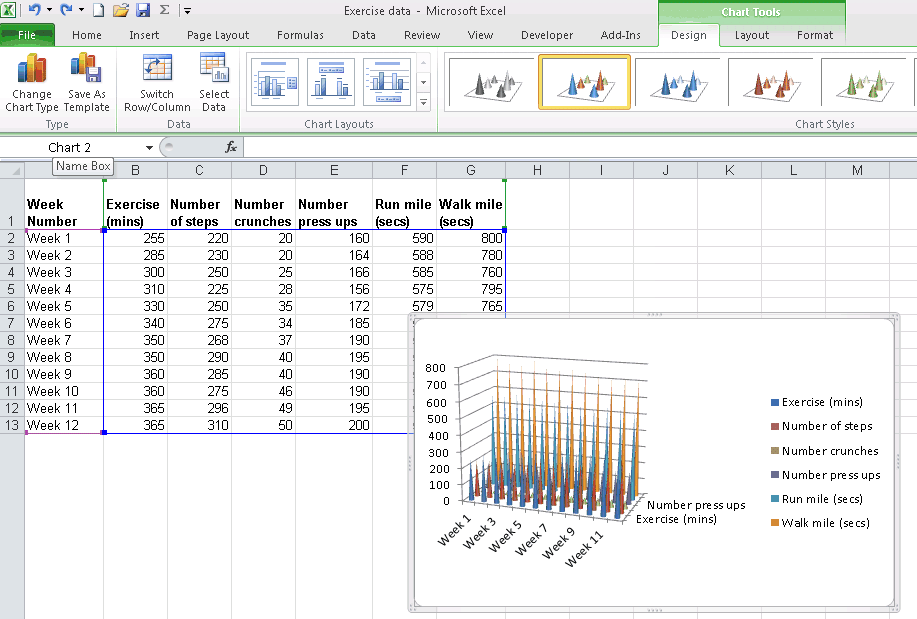
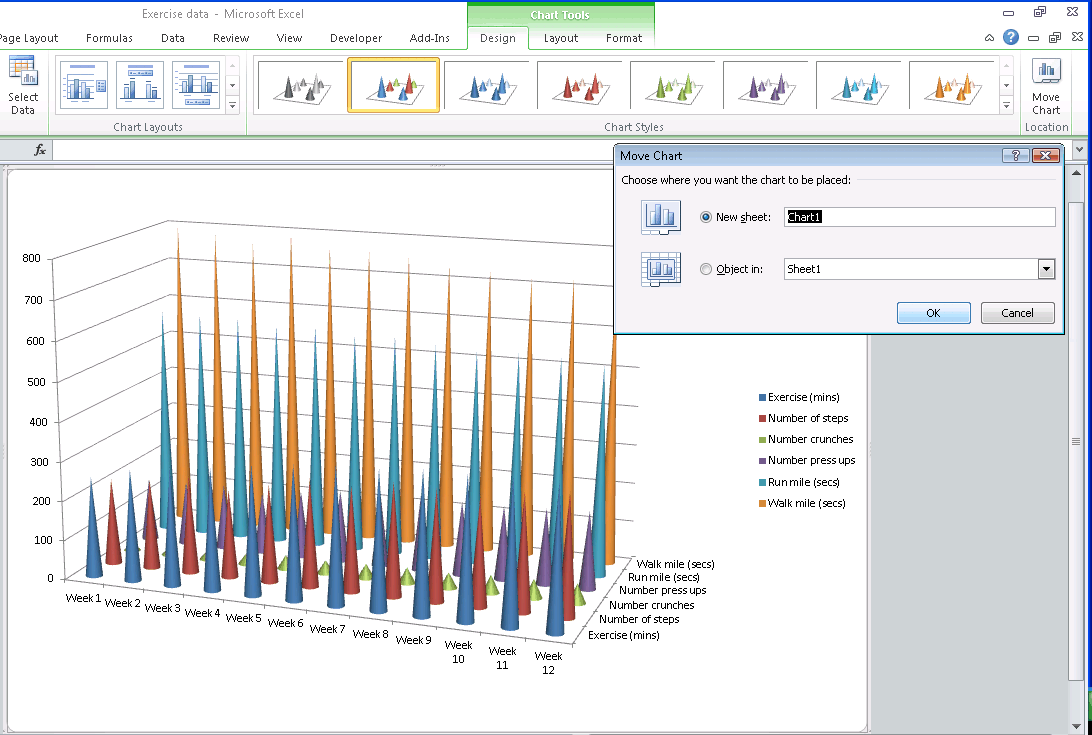
(Click on this picture to expand and view it) Locations for chartsBy default the chart is placed within the same sheet as the data which makes it rather crushed. To remedy this click on Move Chart and select New Sheet.
(Click on this picture to expand and view it)
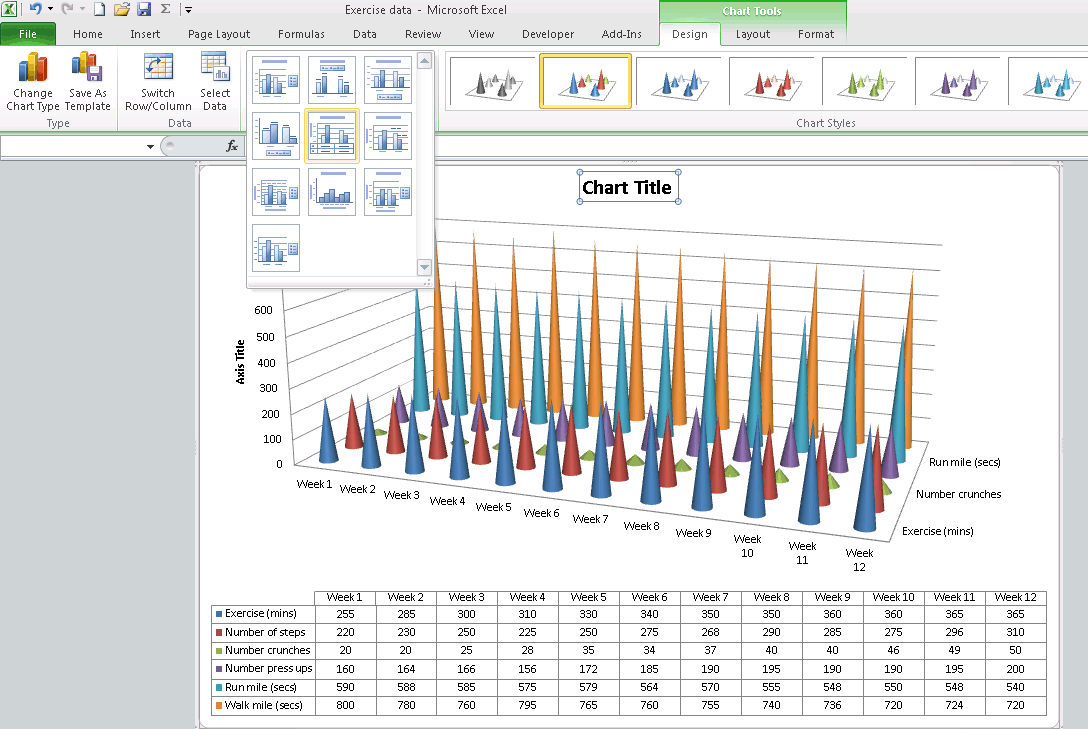
If required you can now choose an alternative layout from the Chart Layouts box – Layout 5 includes a table beneath it. To complete this chart click on the text box to replace Chart Title with Fitness Regime.
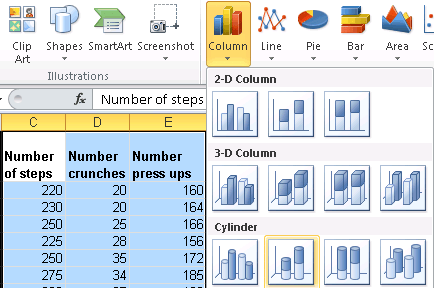
(Click on this picture to expand and view it) Stacked Cylinder chartAs another example of a chart select C1..E13 and select Stacked Cylinder as the Column chart type:
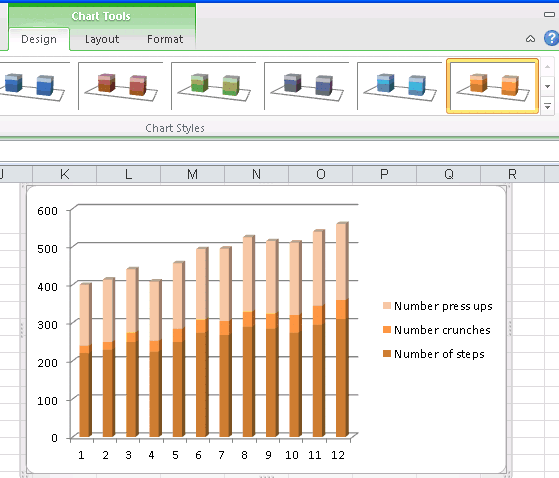
The resulting chart is clear enough to have as a sheet object but looks more attractive by choosing shades of a single colour using the Chart Styles feature which appears in the Design Tab in the ribbon when the chart is the active object on the worksheet:
|
|||||
| Last Updated ( Wednesday, 13 October 2010 ) |