| Moving to Excel 2010 |
| Written by Janet Swift | |||||
| Wednesday, 13 October 2010 | |||||
Page 4 of 4

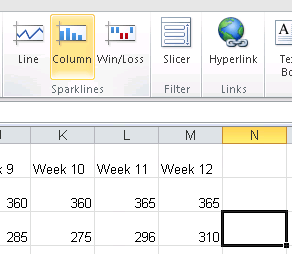
SparklinesSparklines are a new feature in Excel 2010 and gives a quick and easy way of visualising data. In order to use it with this data we first need to rearrange the data so that the different activities are presented row-wise rather than in columns. What we need to do is to transpose the range and this can be done with a copy and paste operation which also introduces us to the new print preview feature in Excel 2010. Using PasteSelect the range A1.. G13 and copy it (either using Ctrl+C or clicking on the Copy icon in the Clipboard section. Place the cursor in A1 on Sheet 2 and click the arrow below the Paste icon. This opens the various Paste options and as you hover all the cursor over each of the icons you'll see a preview of them. The transpose icon is at the right of the second row, once you see the data in the form you want it click the icon. Column SparklinesMove to the Insert tab, which is where the Sparklines facility is found. Place the cursor at the end of the Number of Steps row. i.e in N3, and click on the Column icon in the Sparklines section.
In the Create Sparklines dialog box enter the data range B3:M3 and click on OK. The Sparkline that appears is a bit crushed so widen the column (to do this just drag on the boundary between the column headings N and O. We want the same type of Sparkline for the other the countable quantities we expect to increase as stamina is improved. - the number of crunches and press ups and we can save effort by simply copying/ Using the Autofill handle simly drag from N3 down into N4 and N5.
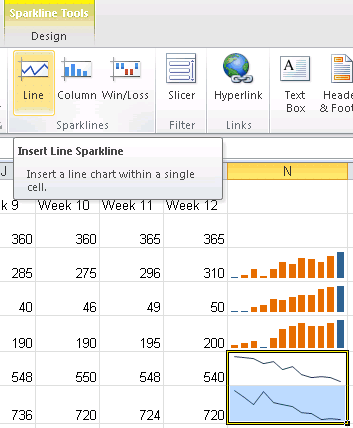
Line SparklinesThe next two rows are for speed of performance and so we hope to see a decrease in the number of seconds, for these we'll use Line Sparklines. This time let's do both in a single operation. Select cells N6 and N7, Place the cursor at the end of the Run mile row. i.e in N6, and click on the Line icon in the Sparlines section. This time enter the data range B6:M7 in the dialog box and click on OK and the two mini-line charts will appear.
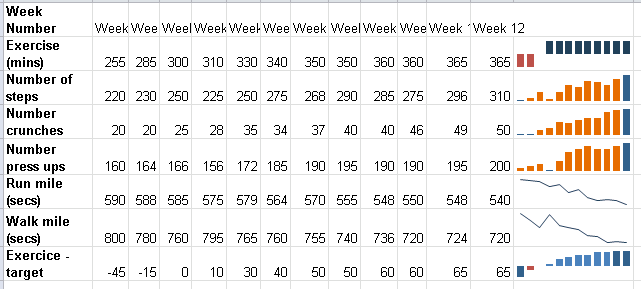
Win/Loss SparklinesThere is a final type of Sparkline, Win/Loss and it is appropriate for the remaining quantity, Exercise (mins). If you followed the original Fitness Monitoring articles you'll know that there was a target of 300 minutes for weekly exercise. So a value above 300 is a "win" and one below it is a "loss". First we need to work out in which weeks the target was met or exceeded. To do this type ExcerciseTarget in A8 and the formula =B2-300 in B8 and copy this across the row using AutoFill. To display the Win/Loss Sparkline as the top sparkline place the cursor in B2 but enter B8..M8 as the range. In fact using a column sparkline is rather more effective as you can see - the Win/Loss option is in the top row and the equivalent Column in the bottom row:
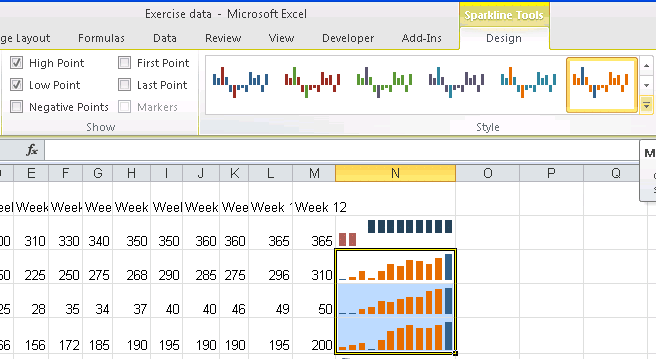
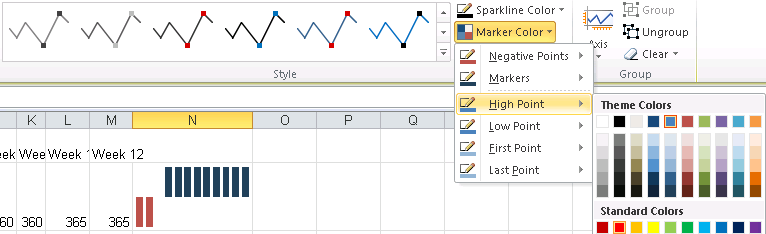
Customising SparklinesBefore finishing with Sparklines let's see how they can be customised. Using the Design palette in Sparkline Tools you can convey extra information. With the Sparkline in N8, a Column Sparkline, click on the Design Tab and then put a tick beside both High Point and Low Point in the Show section and then on the arrow below Design and choose a colour combination from the palette. Notice that the options chosen apply to the group of three column sparklines.
(Click on this picture to expand and view it)
Now place the cursor in N6 and notice that both Lines are selected. In this case tick High Point, Low Point. By default High is flagged as "good" and Low as "bad" but in the case of speed the smaller the number of seconds the better so use the Marker Color drop down pallete to choose alternatives - such as green for low and red for high:
 (Click on this picture to expand and view it) 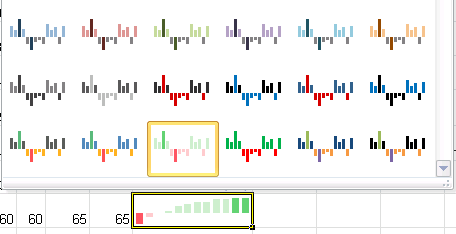
Find more spreadsheets
|
|||||
| Last Updated ( Wednesday, 13 October 2010 ) |