| Introduction to Cashflow |
Page 4 of 4
Number of periodsSimilarly if you want to know how long you will have to wait before a savings plan produces a given sum i.e. the FV then you have to work out
This too is a horrible looking formula and so there is corresponding financial function -
Once again I is the interest rate, S the periodic sum, PV the Present value, which can be zero, and FV the Future Value. The final parameter type is zero or one depending on whether the payments are at the start or end of each time period. For example, if you want to save for a final sum of $697.7 at an interest rate of 6% per annum paid monthly and you can save $10 per month then then you would use:
which returns a result of 59.999 months which agrees with the previous example i.e. roughly 5 years. Notice that in this case it is vital that you get the sign on the payment correct. If you enter a positive value then this means that the savings plan pay you $10 at the end of each month and to reach the final FV you would have to "save" for -86 months. A result that is mostly nonsense! You can, of course, include an inital sum in the saving scheme and specify if the payments are to be at the start or the end of each period. InterestNow we come to the interesting calculation of the interest needed to make a regular payment of S grow to FV in n periods. This problem has no easy solution. There literally is no way of juggling the values in the formula to solve for I. The best we can do is make a guess at I and see if the value of FV computed using it is too high or too low. Using this information a new guess can be made that is closer to the correct value. The process is repeated until the guessed value of I is close enough to the value that we are looking for. This guessing process is generally called ‘iteration’ and some spreadsheets do provide a financial function that will solve for I. Most spreadsheets have a RATE function which can be used to find the interest rate for a savings plan as
where n is the number of periods, S the payment, PV the inital balance, FV the final balance, type is zero or one depending on whether the payments are the start or the end of the time periods and guess is a guess at what the interest rate is. If you don't specify a guess then a random value is used as the starting value. For example, if you want to accumulate $697.7 by saving $10 per month for five years you would need to find an interest rate of:
which is 6% per annum paid monthly. Notice the need to multiply by 12 to convert the monthly rate to a per annum rate. The question remains what should be done in the case of a spreadsheet that doesn’t have a financial function to calculate I? The solution is to implement the iterative method directly. Using standard techniques (Newton's method) it is relatively easy to work out that if I is a guess at the interest rate then
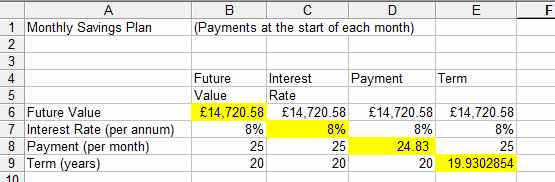
is closer to the true value. This is another horrible looking formula but once entered into a spreadsheet it can be worked out without effort. The big difference is that it has to be worked out more than once to repeatedly improve the guess until it is close enough to the true value to make no practical difference. Each time the new I obtained from the use of the formula is fed back into the equation to give another new value of I and so on until the change in the value with each iteration is very small. This may sound very complicated but in fact it is very easy to incorporate into a spreadsheet. A savings plan calculatorUsing the formulae derived in the previous section it is fairly simple to create a savings plan calculator that will supply the missing value given any three of FV, S,I and n. First enter the text in columns A and B and rows 1,2, 4, 5, 6, 7 and 8 as shown in below.
The savings spreadsheet The actual work of calculation is done in each of the columns B, C, D and E. Each column calculates one of FV,I, S and n as indicated by its heading. The relevant formulas are:
and
Now if you enter some values into each of the empty cells (yellow in the figure) you will see the formula in the same column work out the missing value. The type parameter is set to 1 in each case because you usually want to calculate a savings plan so that the payments are at the start of each time period. Notice that the use of negative signs to indicate which values are paid out from the user. The PMT function automatically gives the correct answer as a negative value but as all of the other payments in the row have been entered using the convention that payments are positive a minus sign is added. Also notice that the NPER function automatically returns the answer in months but the spreadsheet is working in years - hence the division by 12 - and the Rate function returns a monthly interest rate - hence the need to mulitply by 12 to give a per annum rate. Generally it's the attention to detail such as signs and units of time that makes a financial spreadsheet trickier than you might initially think!. A formula summaryThe formulas introduced in this chapter:
For a savings plan type is usually set to 1 and PV is often 0.
Financial Functions
Buy from AmazonSpreadsheets take the hard work out of calculations, but you still need to know how to do them. Financial Functions with a spreadsheet is all about understanding and reasoning, using a spreadsheet to do the actual calculation.
<ASIN:1871962013> <ASIN:B07S79ZVMQ> To be informed about new articles on I Programmer, sign up for our weekly newsletter, subscribe to the RSS feed and follow us on Facebook or Linkedin.
Comments
or email your comment to: comments@i-programmer.info <ASIN:1118490444> <ASIN:B07S79ZVMQ>
|