| Social Media Use - How, Where and Why |
| Written by Janet Swift | |||
| Saturday, 08 December 2012 | |||
|
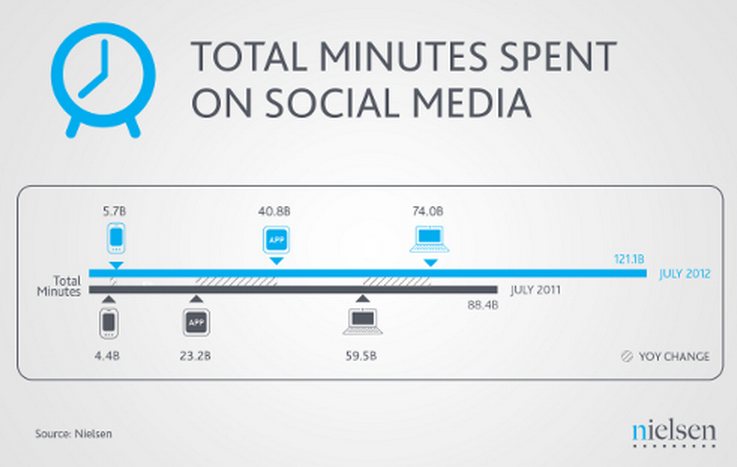
Social media is taking over our lives. We didn't need a research report to tell us that. However, the details of how, why and even when we use social networking is both interesting and useful. According to Nielsen and NM Incite’s latest Social Media Report, consumers in the United States continue to spend more time on social networks than on any other category of sites - roughly 20 percent of their total time online via personal computer (PC), and 30 percent of total time online via mobile. The report found an dramatic 37% year on year increase (between July 2011 and July 2012) in the total spent on the social media, such that in July 2012 in the US, across PCs and mobile devices,121 billion minutes was spent on Social Media.
(click on chart to enlarge) Although the above graphic shows that users connect using PCs and mobiles in fact there's a wider range of devices in use:
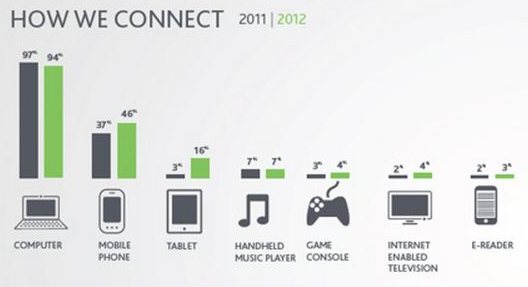
(click on chart to enlarge) The use of tablets to access social media has had a more than five fold increase year-on-year - from 3% to 16% and using a computer for this purpose has actually declined from 97% to 94%. For this survey questions were included to discover where we use social networking. The age group most likely to use social networking in the office were 25-34 year olds, over half (51%) of whom did so. Nearly a third (32%) of those in the youngest age group surveyed, 18-24 year olds, admitted to using social networking in the bathroom.
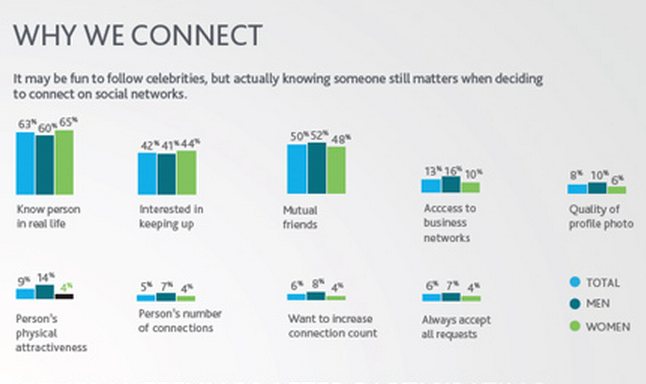
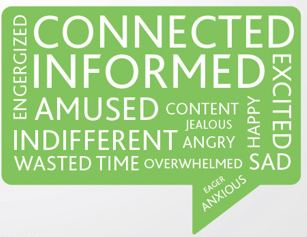
(click on chart to enlarge) The reasons why people connect with other people were also explored revealing interesting differences between man and women. The main reason for deciding who to follow is having a real-life connection although this was more important to women (65%) than men (60%). Men were more likely than women to follow a person's mutual friends and for business networking. A person's physical attractiveness attracted 14% of males but only 4% of women and only 6% of the survey said they always accept requests. The most prevalent feeling after participating in Social networking was that of being "Connected" and 76% of responses were positive. There were however 21% of negative emotions including those of being jealous, anxious and sad.
More InformationNeilen Social Media Report 2012 Related ArticlesFacebook vs Google - Developer's Take
To be informed about new articles on I Programmer, install the I Programmer Toolbar, subscribe to the RSS feed, follow us on, Twitter, Facebook, Google+ or Linkedin, or sign up for our weekly newsletter.
Comments
or email your comment to: comments@i-programmer.info

|
|||
| Last Updated ( Saturday, 08 December 2012 ) |