| Plotly Adds Offline Only Mode |
| Written by Kay Ewbank | |||
| Thursday, 01 August 2019 | |||
|
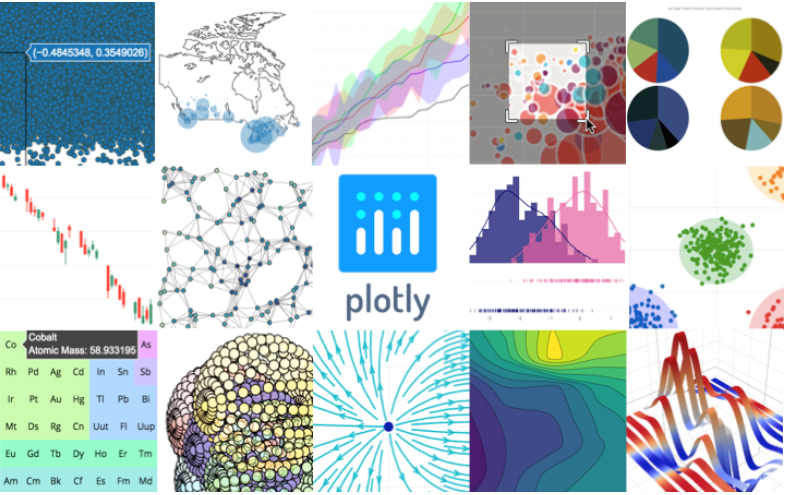
Plotly.py has been updated with improvements including an offline only mode and the inclusion of Plotly Express. Plotly.py is a Python data visualization framework best known for being used for the graphs and maps for the Dash analytical web applications framework. Plotly is interactive, open-source, and browser-based. It is built on top of plotly.js which is an open source JavaScript declarative charting library. Plotly.js has over 30 chart types, including scientific charts, 3D graphs, statistical charts, SVG maps, and financial charts. Plotly graphs can be viewed in Jupyter notebooks, standalone HTML files, or hosted online.
The headline change to the updated version of Plotly.py the way offline charts are displayed. Until now, you could create figures in either an online on an offline mode. Online figures were uploaded to an instance of Plotly’s Chart Studio service and then displayed. Offline figures were rendered locally. The developers of Plotly say this caused confusion, so the new release only supports offline mode. This means figures need no internet connection, and users don't need a Chart Studio account or to pay for anything. If you still want to have figures rendered and displayed online, you can, but the online mode has been moved into a separately-installed package called chart-studio.
The next change to Plotly is the inclusion of Plotly Express as the recommended entry point into the library. The developers released Plotly Express earlier this year as a standalone library designed to make it easier and faster to create Plotly figures from tabular data using just a single line of Python. The developers say Plotly Express was extremely well-received by the community and starting with version 4, Plotly now includes Plotly Express built-in. Plotly Express supports a wide variety of charts, including otherwise verbose-to-create animations, facetted plots and multidimensional plots. The final improvement to the new release is a new rendering framework that lets you display Plotly figures in most locations. It is compatible with not only Jupyter notebooks but other notebook systems such as Colab, Azure and Kaggle notebooks, as well as IDEs including PyCharm, VSCode and Spyder. Other options include Dash apps, static raster and vector files, standalone interactive HTML files, and embedded into websites. Plotly is available on GitHub or from PyPI.
More InformationRelated ArticlesPython 3.7 Adds Data Handling Classes Visual Studio Code Python Gets Data Science Kit Jupyter Notebook 5 Adds Cell Tagging ActivePython Adds Packages For Data Science And Web Development To be informed about new articles on I Programmer, sign up for our weekly newsletter, subscribe to the RSS feed and follow us on Facebook or Linkedin.
Comments
or email your comment to: comments@i-programmer.info |
|||
| Last Updated ( Saturday, 10 August 2019 ) |


