| Google Gets Hot |
| Written by Kay Ewbank | |||
| Wednesday, 12 February 2014 | |||
|
You can now check temperature records anywhere in the world using Google Earth. The world temperature records have been made available by climate researchers at the University of East Anglia. Users can scroll around the world and zoom in on 6,000 weather stations. The underlying data gives the land-surface air temperatures, and use the Climatic Research Unit Temperature dataset. Using Google Earth, users can scroll around the world and zoom in on 6,000 weather stations to view monthly, seasonal and annual temperature data. The details include around 20,000 graphs, some of which show temperature records dating back to 1850. Dr Tim Osborn from UEA's Climatic Research Unit said: "The beauty of using Google Earth is that you can instantly see where the weather stations are, zoom in on specific countries, and see station datasets much more clearly.” The data has been available on the university’s website and the UK Met Office website, but the researchers wanted to make the dataset as interactive and user-friendly as possible.
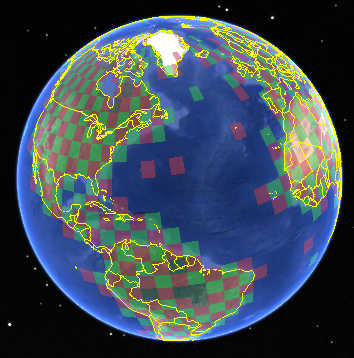
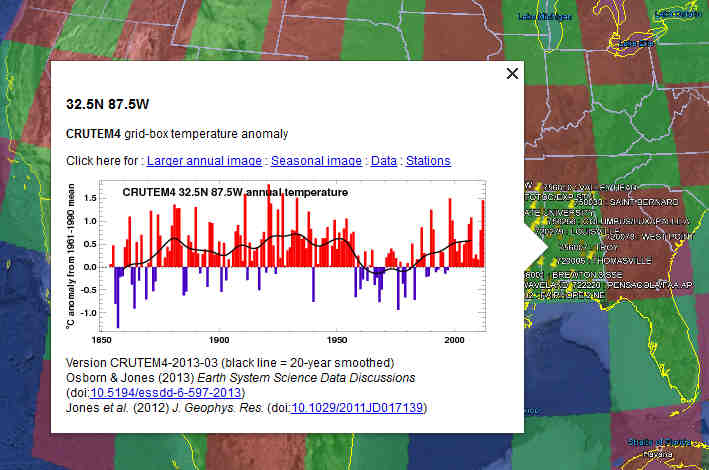
An online rendition of the dataset -- the weather station monthly temperature data and their locations, the grid-box monthly temperature anomalies, and seasonal and annual timeseries graphs of all these data - is accessed via an interface written in Keyhole Markup Language (KML). The KML file overlays these locations onto the three-dimensional representation of the Earth provided by Google Earth. In use, you see the globe split into 5° latitude and longitude grid boxes. The boxes are about 550km wide along the Equator, narrowing towards the North and South poles. This red and green checkerboard covers most of the Earth and indicates areas of land where data is available. If you click on a grid box you’re shown the area's annual temperatures, as well as links to more detailed downloadable station data.
The team expects some errors to surface. Dr Osborn said: "This dataset combines monthly records from 6,000 weather stations around the world – some of which date back more than 150 years. That's a lot of data, so we would expect to see a few errors. We very much encourage people to alert us to any records that seem unusual.” There are also some gaps in the grid because of a lack of weather stations in remote areas such as the Sahara.
More InformationDetails about the dataset and how to view it Related ArticlesData Analytics for Weathering Storms
To be informed about new articles on I Programmer, install the I Programmer Toolbar, subscribe to the RSS feed, follow us on, Twitter, Facebook, Google+ or Linkedin, or sign up for our weekly newsletter.
Comments
or email your comment to: comments@i-programmer.info

|
|||
| Last Updated ( Wednesday, 12 February 2014 ) |