| The Minimum Spanning Tree - Prim's Algorithm In Python |
| Written by Mike James | |||||
| Thursday, 05 October 2023 | |||||
Page 2 of 4
Prim's Algorithm In Python - The NetworkStarting with a new Python Tkinter project we need to add a button labelled "Generate Network" and a Canvas object. A Tkinter Canvas object is often a good thing to use when you need to draw using x,y co-ordinates, but there are other ways of doing the same job. Moving to the code. We need a list to hold the co-ordinates of the points: Pos=[] size is a constant that sets the size of the network in number of vertices. size=8 The array to hold the network data can be defined as Network=[] We are going to have to set the structure of this two dimensional list of lists when we store data in it. We can now write a method that fills both Pos and Network with random values and calls another function to draw the network: def setnet(canvas): Network and Pos are global variables but they still have to be initialized and we do this using list comprehensions. The points are generated randomly with co-ordinates between minlength and maxlength which are derived from the size of the Canvas object. Notice that the distance array is made to be symmetric and the diagonal is also set to zero. The distance between points is computed using an additional function. The distance function is simply the usual Euclidean formula: def distance(a, b): After generating the network it would be nice to view it. A drawing routine is quite easy – as long as you don't worry too much about efficiency. We can simply use Line objects to draw lines on the Canvas. First we clear the Canvas of any child nodes it may already contain: def showNetwork(canvas,Network): Next we draw a new Line for each pair of points that have a large enough distance between them: for i in range(size): Next we can plot suitable marker shapes at the position of each node: for i in range(size): To try this our with need to place a button on the canvas in the main program: top = tkinter.Tk() C = tkinter.Canvas(top, bg="blue", button=tkinter.Button(top,text="Generate Network", You can now try the program out and see if it really does generate reasonable graphs. It should! You can size the canvas control to make best use of the space and the graph will adjust itself to fill it, more or less. It is fun just to see the range of graphs that can be produced.
<ASIN:1565924533> <ASIN:1584883960> <ASIN:1584883960> <ASIN:0201000237> |
|||||
| Last Updated ( Sunday, 06 October 2024 ) |
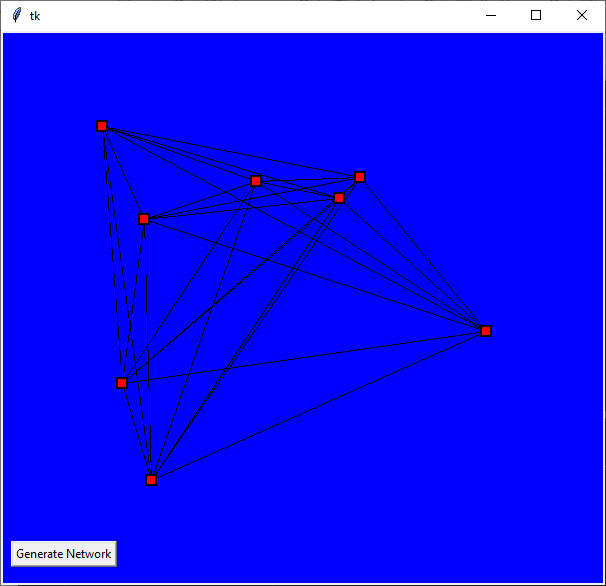 A typical random graph with eight vertices