| Advanced Investment Analysis |
| Written by Janet Swift | |||||
Page 1 of 4 Two key functions for gauging the worth of an investment with an irregular cash flow are internal rate of return (IRR) and its counterpart XIRR for an unevenly spaced schedule of cash flows and the modified internal rate of return (MIRR). We look at how to use them in Google Sheets. Financial Functions
Buy from AmazonSpreadsheets take the hard work out of calculations, but you still need to know how to do them. Financial Functions with a spreadsheet is all about understanding and reasoning, using a spreadsheet to do the actual calculation.
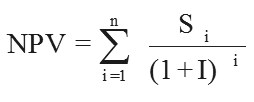
<ASIN:1871962013> <ASIN:B07S79ZVMQ> In a previous extract, in which we explored how NPV (Net Present Value) can be used to make investment decisions, we found that the NPV is a very good and stable measure of the worth of an investment. However, there are many others and perhaps the best known, and most complicated is the Internal Rate of Return (IRR). Understanding exactly what it means is a good step toward making correct use of it. Internal Rate of ReturnIRR is the interest rate which reduces the NPV of the total cashflow to zero. In other words, it is the interest rate that you need to break even on the investment. Clearly, if the NPV is zero then so is its future value. Also notice that if the cash flow corresponds to either a repayment loan or an annuity then the IRR is equal to the usual quoted interest rate. Clearly the ‘positive NPV’ investment decision rule has a simple IRR equivalent:
Of course this raises the question of which the prevailing interest rate should be? If you are comparing the investment against the alternative of a safe investment then you should use the prevailing rate for deposits. If you are planning to borrow the money for the investment then the the rate for loans should be used. In the current turbulent economic conditions the comparison is complicated by trying to predict how interest rates could change over the lifetime of the cash flow - which makes IRR a particularly attractive function to use as it asks for a guess as a parameter. Also notice that the IRR calculation assumes that the money in the cash flow could be always be invested at the IRR rate even though this rate my not be available on the open market. That is, if the IRR is 10% then this gives a zero NPV assuming that any cash in the cash flow can be invested at 10%, which might well not be the case. This is considered to be a defect in the IRR as a measure of the worth of an investment and is the reason for preferring the MIRR. Put another way, we are assuming that the value of money over time is governed by the computed IRR and not the prevailing safe market rates. As the IRR is the rate that makes the NPV zero, we have to find a value of I that makes the NPV zero in this equation: It should come as no great surprise that the IRR cannot be calculated directly. To determine the IRR a complex equation involving all of the cashflows has to be solved. The only practical method of doing this is to use iteration. Fortunately, nearly all spreadsheets have an IRR function that lets you do this:
where guess is an initial guess to start the iterative process and range is the part of the row or column that contains the cashflow data. Usually guess is an optional parameter.
A subtle point is that while the NPV function generally works with cashflows that occur at the end of each time period, the IRR function generally allows for the first cashflow to be at the start of the first time period. In other words, the IRR function assumes that the investment will be a conventional one with a cash outflow at the start and then positive or negative flows thereafter. For example, the cashflow shown below has the NPV and NFV assuming an 8% interest rate as shown.
Its IRR has been calculated in D9 using the formula
As you can see, the IRR being over 8% suggests that the investment is worthwhile, which is in line with the positive NPV. Notice the use of the guess of 10% as the initial value. If you really have no idea what the IRR is going to be just omit the guess parameter which is optional. Problems with the IRRIRR is a very seductive measure of the worth of a cashflow because it looks so much like a simple interest rate that can be compared with other interest rates but it has a number of serious problems. The first and most quoted of the defects in the IRR is the fact that it is possible for there to be more than one value that satisfies its definition. If you look at the graph of the NPV for a range of percentage rates then for the conventional investment cashflow given above the curve has the overall shape shown below.
You can see that the NPV falls as I increases. This is because the increase in the discount factor makes the positive cash sums worth less and less. Notice that the IRR is the value of I where the curve crosses the x axis that is the value of I for which the NPV is zero. If you draw the same graph for an unconventional type of investment, where the cashflow is at first positive and then negative, the result is a graph that increases with I.
This curve is for the cashflow $4000 followed by -$1000 after each of four years. The reason that the NPV increases with I is that the negative sums are discounted more strongly as I increases and so the NPV actually increases. In both of these cases there is a sensible value for the IRR because there is exactly one place where the graph cuts the x axis. However, it is possible to find cashflows which are a mixture of the conventional and the unconventional. This produces an NPV graph that has the characteristics of the two shown here. <ASIN:0470178892> <ASIN:0262046423> <ASIN:1119067510> <ASIN:078975584X> |